fxcodebase-backup
3 days down indicator
Source: https://fxcodebase.com/code/viewtopic.php?f=17&t=75455
Forum: 17 · Topic 75455 · 2 post(s)
3 days down indicator
Steve_W · Tue Dec 31, 2024 2:54 pm
Hi all,
Here’s a bare-bones oscillator indicator intended for use on stock indices. It is based on this article https://www.businessinsider.com/stock-trading-strategy-quant-fund-manager-competition-champion-sp500-return-2024-9 that describes Ivan Scherman’s method.
Usage: Daily timeframes Stock indices (but may be of use on some other instruments) 3 down candles = look to go long at own discretion, as signalled by indicator Exit on a close above a shorter moving average - or limit order.
Some enhancements have been added in particular looking at the quality of the last candle in the group - wick and body observation for momentum reversal assessment. Comments in the code.
The signal frequency is quite low. Tuning doesn’t seem too critical - across instruments and historical data. The default parameters were found for SPX500 on recent history.
I’ve included screenshots for my own strategy back-test - it requires appropriate money/risk management (I used quite a wide stop based on recent volatility). I may upload the strategy at a later date… more work needed.
Steve
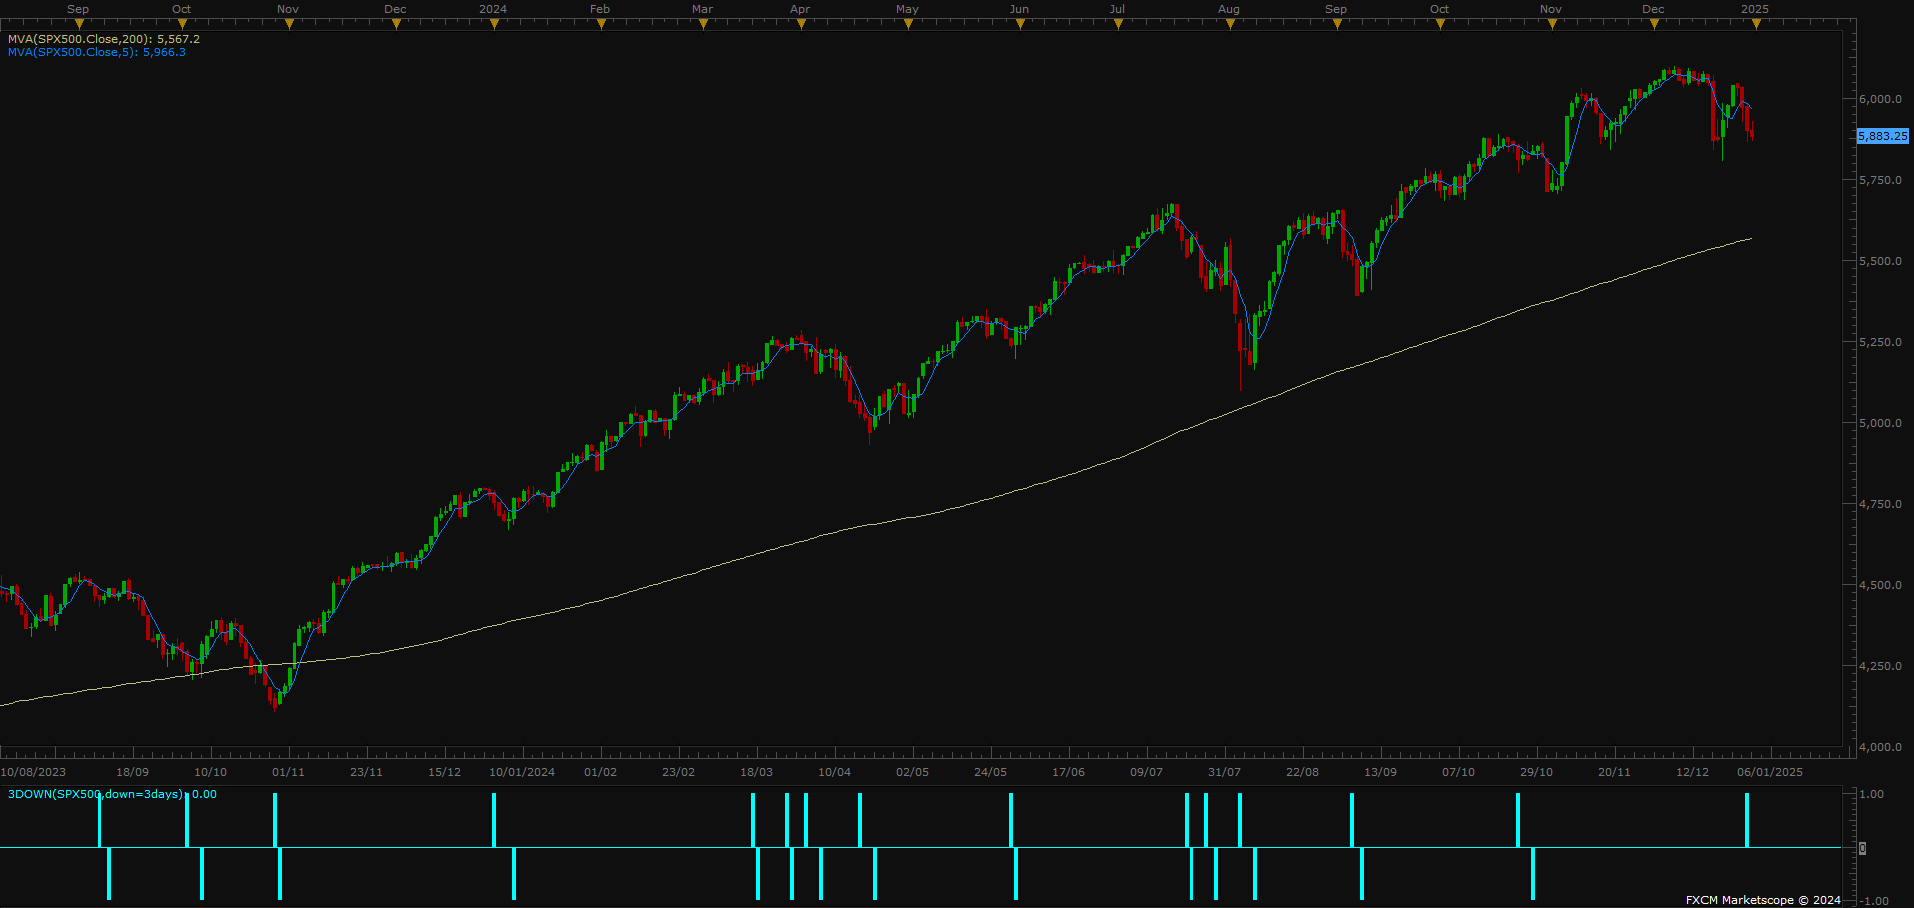
SPX500 daily
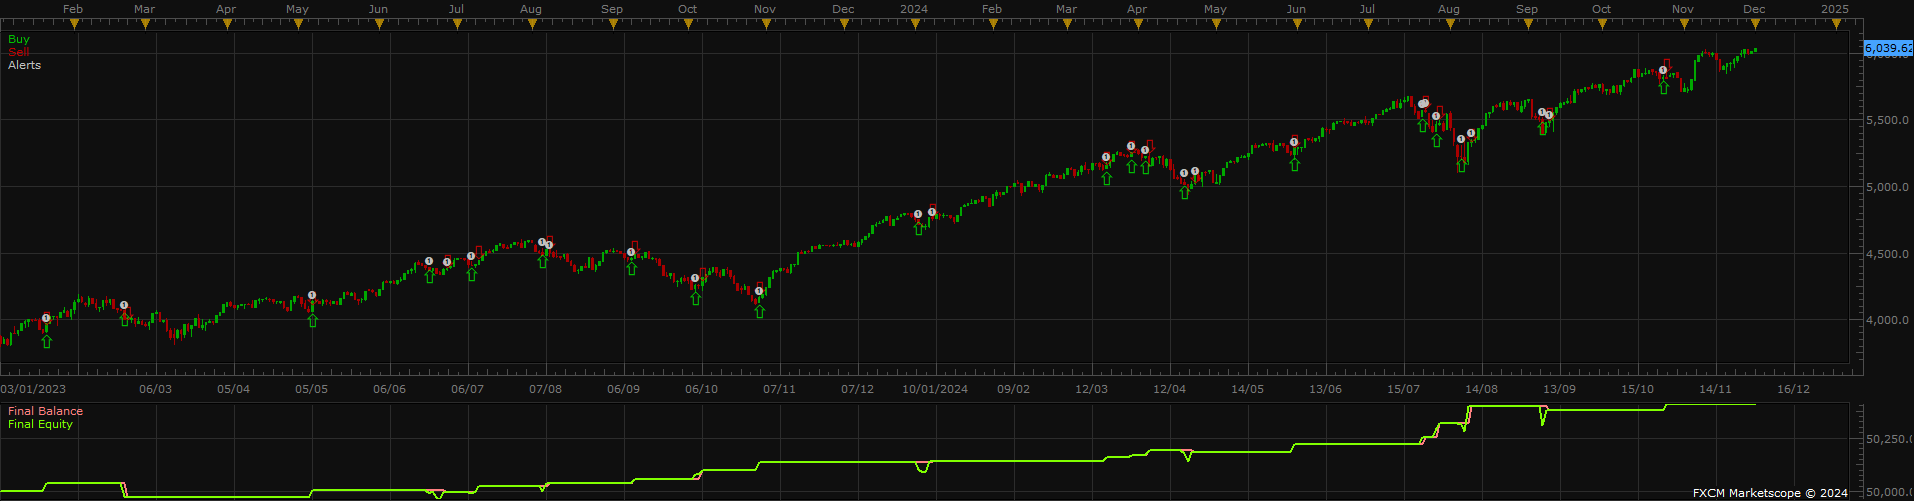
back-test chart and equity curve
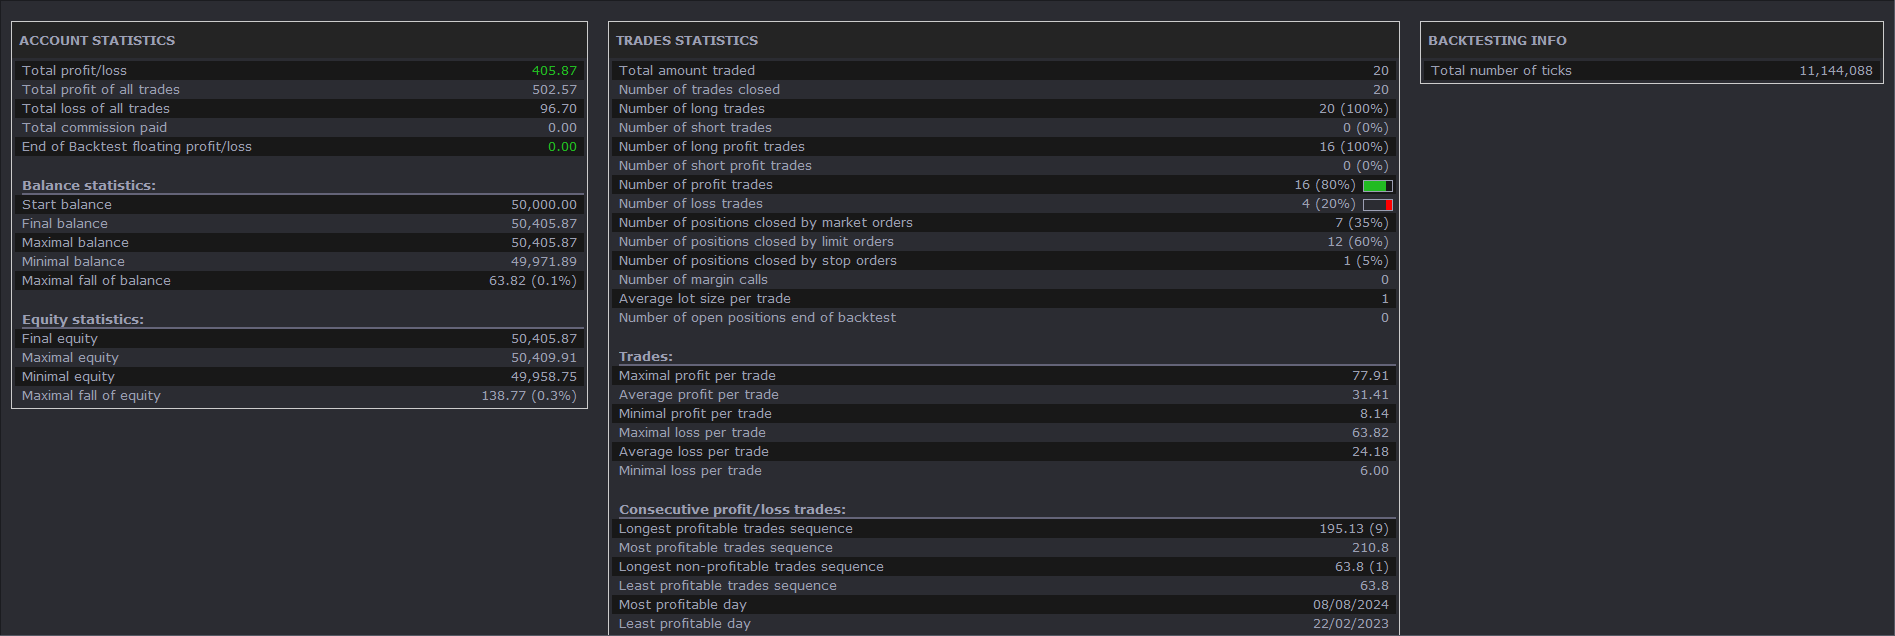
back-test result - order size=1
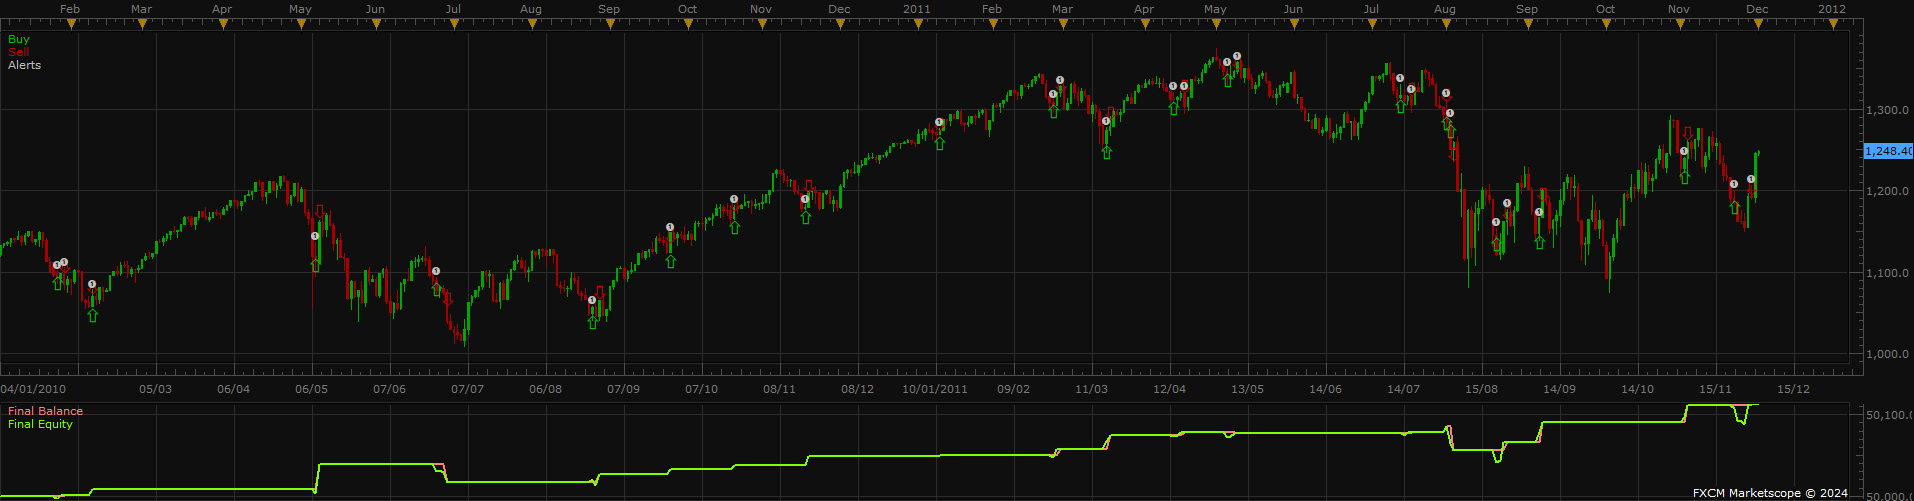
back-test - same config for 2010-2011 data
Re: 3 days down indicator
Apprentice · Mon Jan 06, 2025 4:52 pm
Indicator-Based strategy. https://fxcodebase.com/code/viewtopic.php?f=31&t=75474