fxcodebase-backup
All Time Frames All Currency Pairs Stochastics Dashboard
Source: https://fxcodebase.com/code/viewtopic.php?f=17&t=61299
Forum: 17 · Topic 61299 · 10 post(s)
All Time Frames All Currency Pairs Stochastics Dashboard
Apprentice · Sun Oct 05, 2014 6:14 am
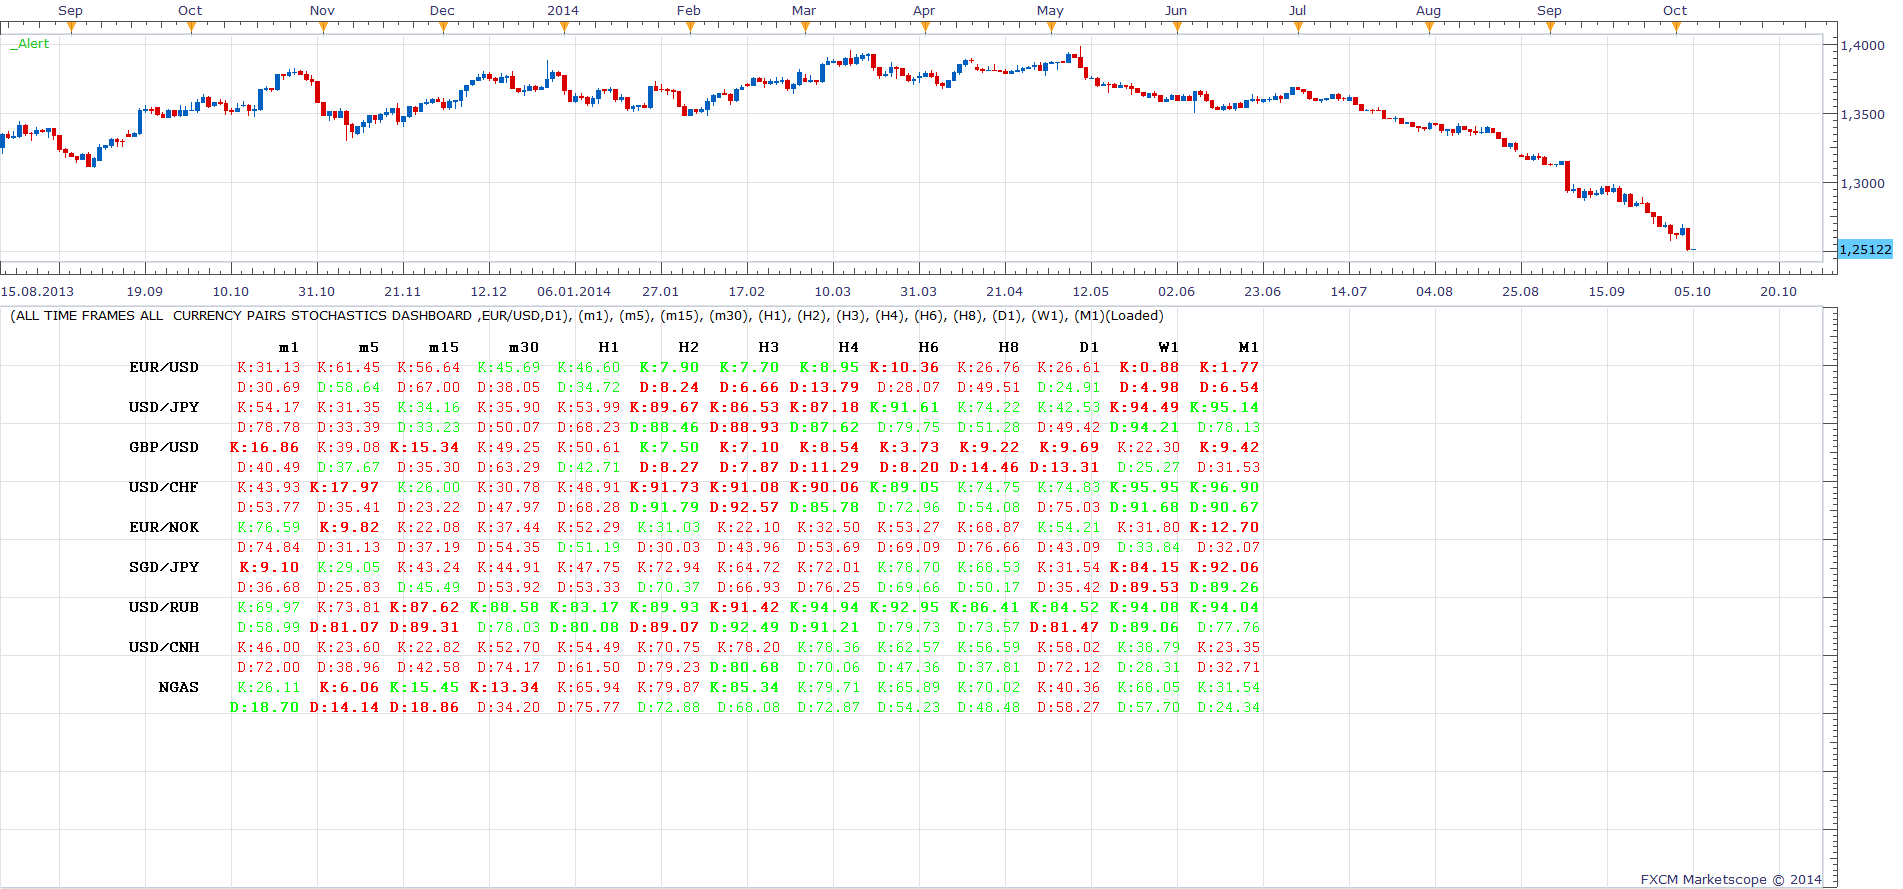
All Time Frames All Currency Pairs Stochastics Dashboard .lua
Re: All Time Frames All Currency Pairs Stochastics Dashboar
Cobie1 · Mon Oct 06, 2014 2:55 pm
Close! Just three things…
- Could you work it so it only displays %K data please?
- When I choose specific timeframes, the column title is not consistent with my selections so I’m not sure whether or not the data is either
- Is there anyway you could get the columns to horizontally space out? Because the data is all squashed up so I can read it, unlike your example!
Thanks again
Re: All Time Frames All Currency Pairs Stochastics Dashboar
Apprentice · Tue Oct 07, 2014 2:02 am
Updated.
Re: All Time Frames All Currency Pairs Stochastics Dashboar
Cobie1 · Thu Oct 09, 2014 3:37 pm
This is brilliant, thank you so much!!
Unfortunately there is one last thing…
Could you get the data to display in the up colour for overbought and the down colour for oversold please?
Re: All Time Frames All Currency Pairs Stochastics Dashboar
Apprentice · Fri Oct 10, 2014 1:36 am
Your request is added to the development list.
Re: All Time Frames All Currency Pairs Stochastics Dashboar
Cobie1 · Fri Oct 10, 2014 12:18 pm
Ok, thanks again.
Re: All Time Frames All Currency Pairs Stochastics Dashboar
FXSteve · Sun Oct 19, 2014 2:21 pm
Hi, in the process of trying to learn more about programming in lua, I had a close look at your indicator and I have a question. Inside the lua file ( All Time Frames All Currency Pairs Stochastics Dashboard.lua ), you have defined the function ReleaseInstance() twice (and they are not identical). Is this a mistake? Thanks.
Re: All Time Frames All Currency Pairs Stochastics Dashboar
FXSteve · Sun Oct 19, 2014 3:04 pm
One of the reasons I am interested in this indicator is because I would like to create a similar indicator for RSI (instead of stochastics) - to show which pairs are oversold and which are overbought, and on which time frame(s). My plan is to list the RSI values as the output and highlight (with color) those numbers which are greater than (or less than) some user-definable value. I think it would be useful to show the two most recent values (for the most recently closed candle and also the current candle which has not closed yet). Being able to choose the RSI period of course is also desirable.
Maybe something like this already exists here on FXCodeBase, but I have not found it.
Re: All Time Frames All Currency Pairs Stochastics Dashboar
Apprentice · Mon Oct 20, 2014 5:02 am
Required can be found here. viewtopic.php?f=17&t=61345
Re: All Time Frames All Currency Pairs Stochastics Dashboar
Apprentice · Fri Apr 13, 2018 8:44 am
The indicator was revised and updated.