fxcodebase-backup
anas bolingar band
Source: https://fxcodebase.com/code/viewtopic.php?f=17&t=66175
Forum: 17 · Topic 66175 · 1 post(s)
anas bolingar band
anashassan76 · Mon Jun 04, 2018 3:34 pm
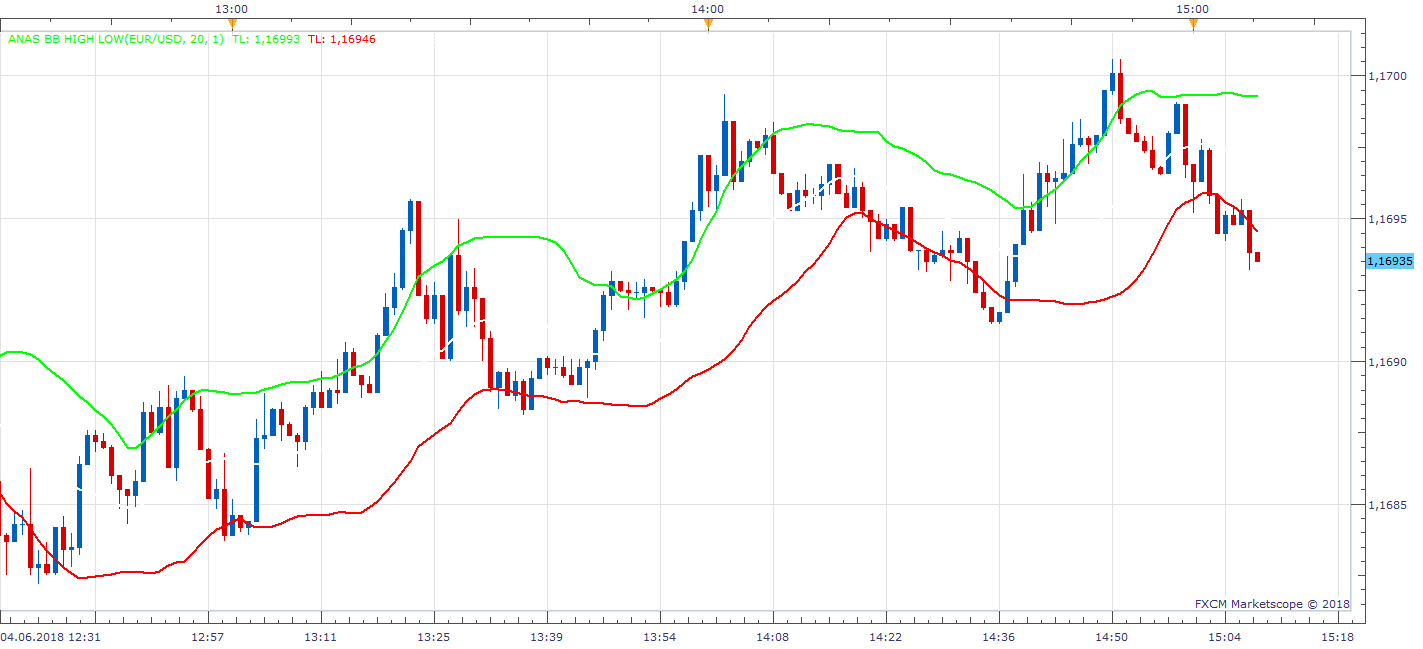
the logic of this indicator . if price close above bb green line buy , if close below red line sell its trend indicator , some false signal expected when market side rang .
the upper band is calculated with the avarage of high and standard divaiation of high values . the lower band is calculated with avarage of low and standard diviation of low values .
mid avarage line is calculated with avarage of close values .
recomend for hour trading with current setting . use ATR to see if there remainig range in the day when intial segnal start . if a buy signal is generated once , all your trade is buy and you can use CCI or stochastic of or %R value of 6 to reinter for next trade .