fxcodebase-backup
Aroon Rainbow
Source: https://fxcodebase.com/code/viewtopic.php?f=17&t=23207
Forum: 17 · Topic 23207 · 3 post(s)
Aroon Rainbow
Apprentice · Sun Sep 09, 2012 5:04 am
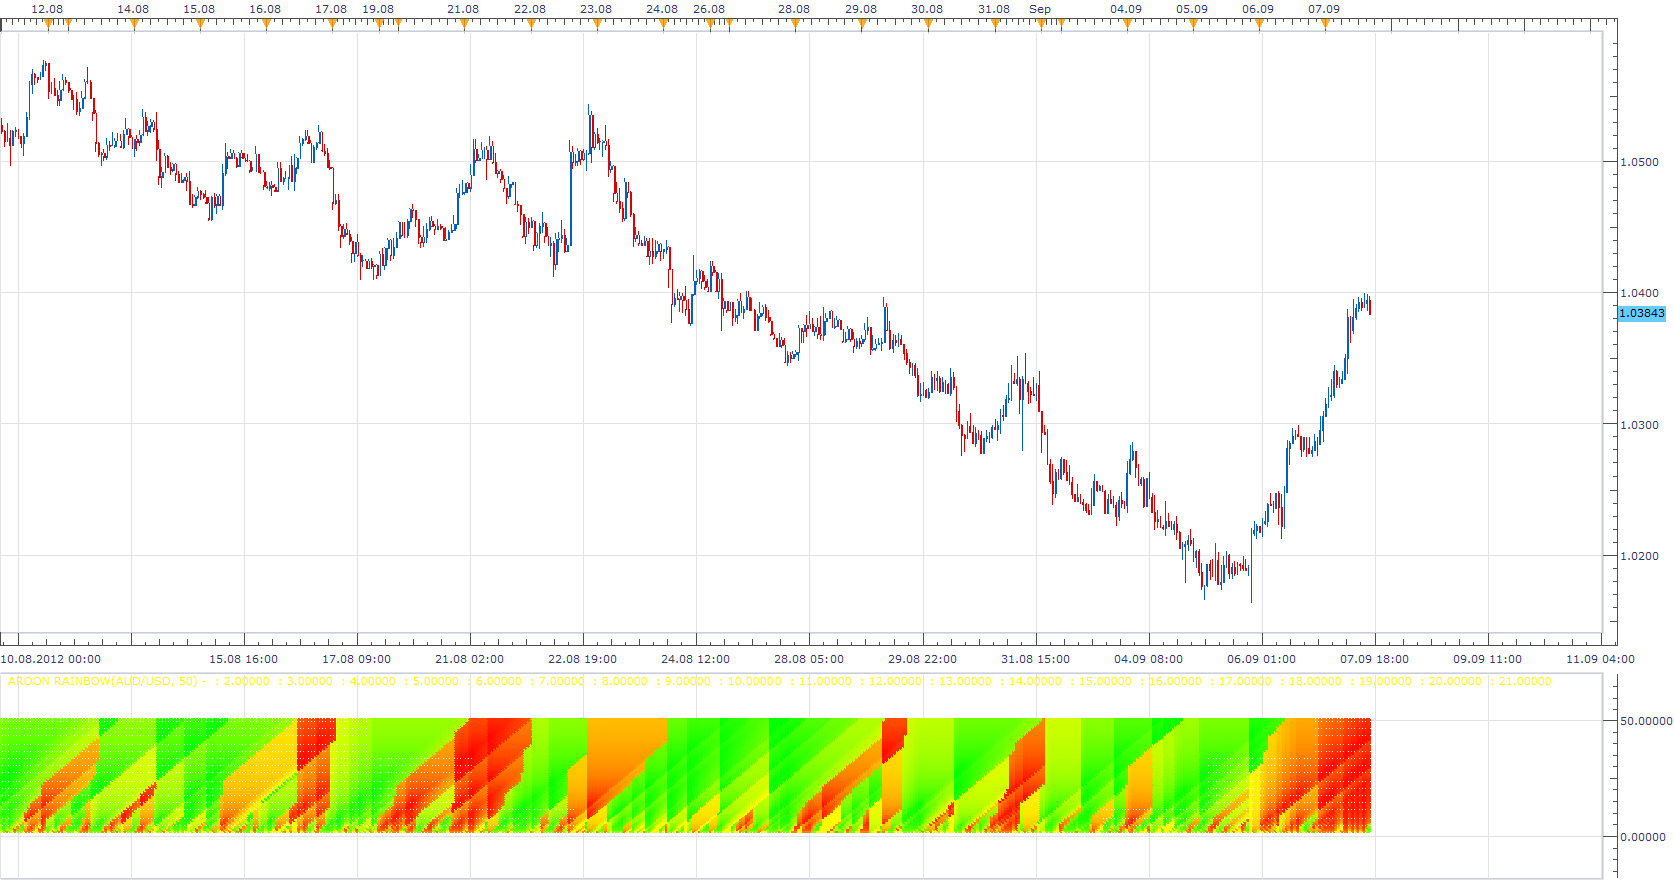
Shows the value of the indicator for all periods.
For this purpose it use 3D averaging algorithm. Every data point is an average of 9 points. Current and Lines above and below, Current and periods before and after.
Also i wrote RSI version. viewtopic.php?f=17&t=22703&p=39237&hilit=rsi+Rainbow+chart#p39237
I’m interested in your opinions about these indicator class, your experiences with them and suggestions on how to improve them.
The indicator was revised and updated
Re: Aroon Rainbow
Apprentice · Thu Nov 06, 2014 3:53 am
Performance and presentation update.
Re: Aroon Rainbow
Apprentice · Tue Jun 27, 2017 3:51 am
The indicator was revised and updated.