fxcodebase-backup
ATR Volatility candle coloring
Source: https://fxcodebase.com/code/viewtopic.php?f=17&t=76021
Forum: 17 · Topic 76021 · 1 post(s)
ATR Volatility candle coloring
Apprentice · Mon Jun 09, 2025 5:02 pm
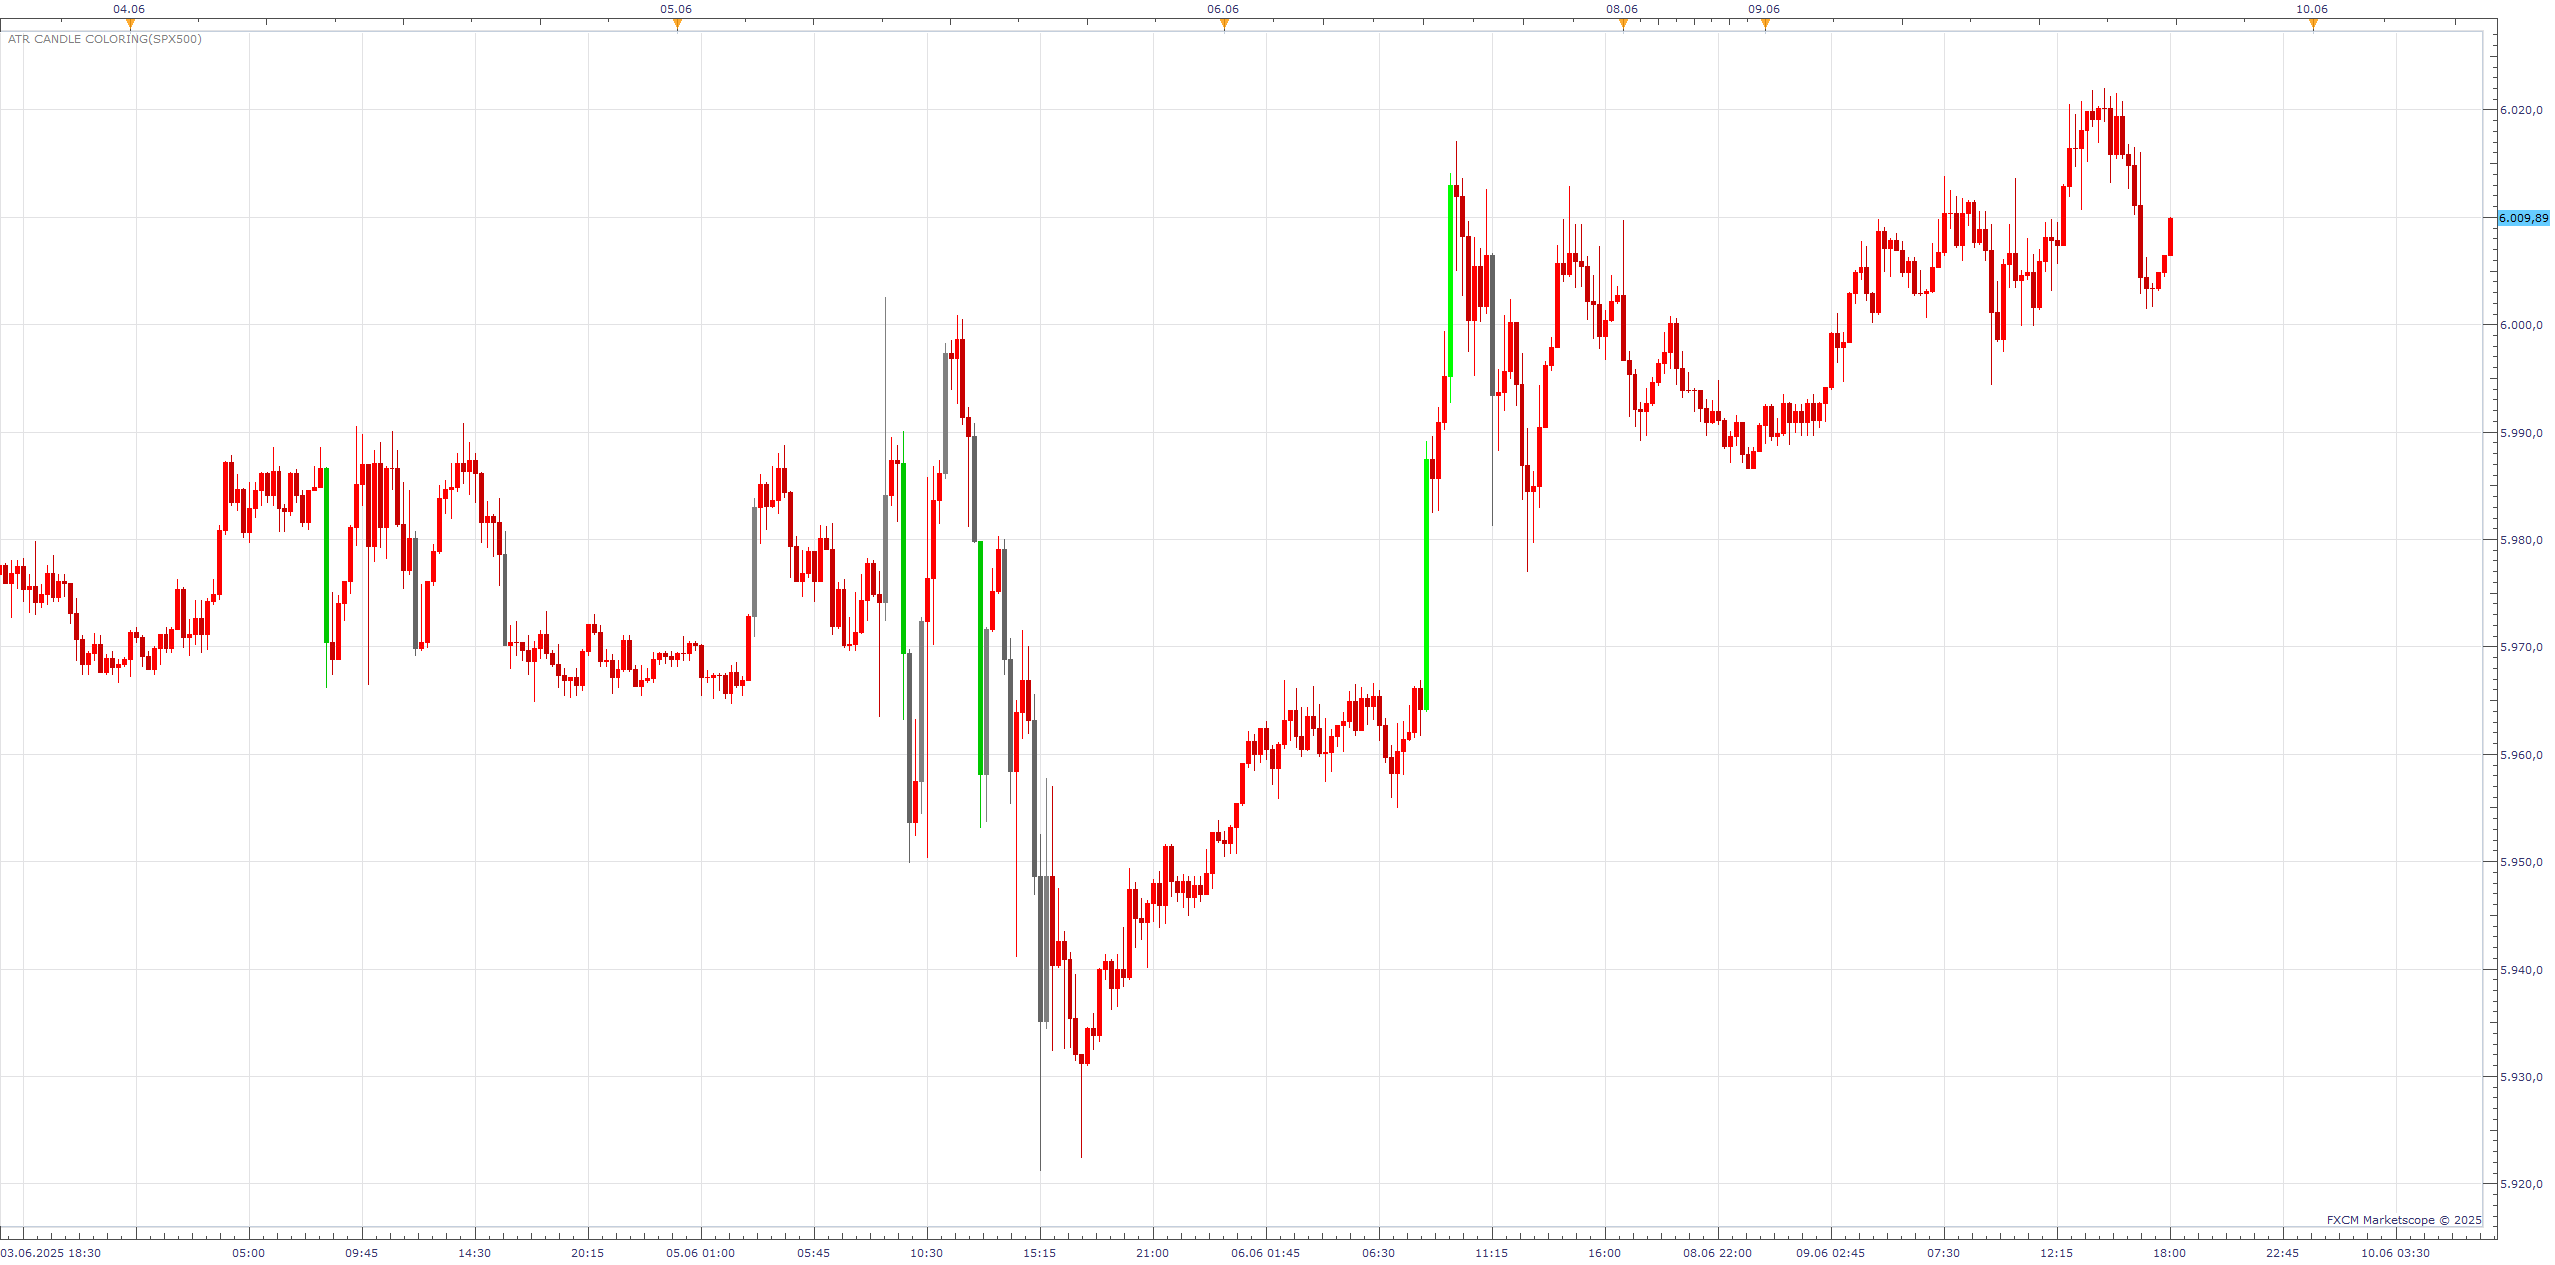
Inspired by video https://www.youtube.com/watch?v=iqeSfjATOIw As a tool for detecting manipulation candles.
How It Works Calculates ATR over the selected timeframe (TF) such as daily (D1).
On the current chart (can be any timeframe), each candle is: Compared against the ATR value from the higher timeframe.
Colored depending on the body size (|Close - Open|) in relation to ATR: Strong candles: Body > ATR × L1 (%) Weak candles: Body < ATR × L2 (%)
Neutral candles: in between