fxcodebase-backup
averages_histogram
Source: https://fxcodebase.com/code/viewtopic.php?f=17&t=69151
Forum: 17 · Topic 69151 · 14 post(s)
averages_histogram
Apprentice · Fri Nov 22, 2019 4:47 am
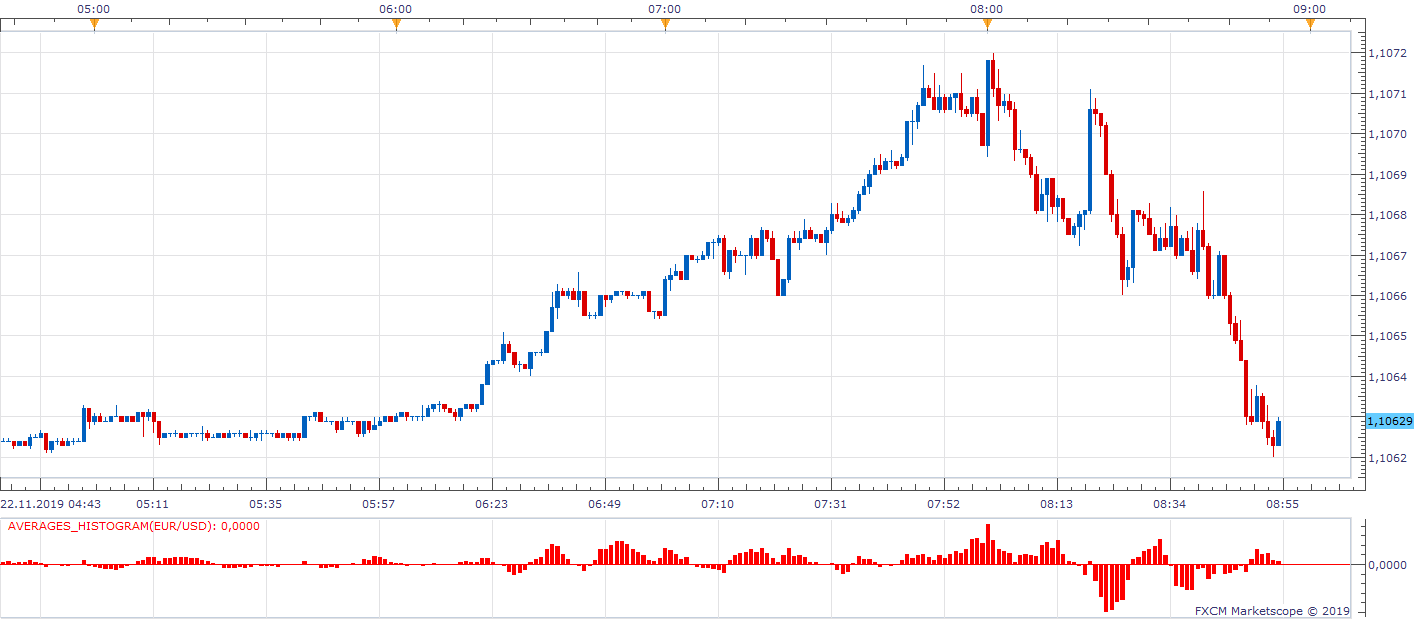
Based on request. viewtopic.php?f=17&t=1589&start=50
Re: averages_histogram
bruno2017 · Fri Nov 22, 2019 5:36 am
Hello and thank you is it possible to color the histogram with the 4 colors of the MA / EMA cloud thank you
Re: averages_histogram
Apprentice · Fri Nov 22, 2019 8:58 am
Try it now.
Re: averages_histogram
bruno2017 · Fri Nov 22, 2019 9:50 am
sorry that did not change anything
Re: averages_histogram
bruno2017 · Sat Nov 23, 2019 7:17 pm
hello
it’s a tradingview indicator that’s how I’d like it to be
@ version = 3
// Add 3x the indicator on the TradingView chart. (Maximum indicator allowed for a free account)
// The indicator is displayed correctly only in 1 minute time unit.
// Two entries in the parameter menu:
// The first to set the unit of time in minutes.
// The second to set the display trimming 0.999 ==> 99.9%

study (title = "Free Warrior Indicator")
src = close

// Entries
TF1 = input ("1", title = "Time Unit 1 (minutes)")
display1 = input (0.998, title = "Cropping display 1", step = 0.002, maxval = 1.0, minval = 0.5)

// Find the selected unit of time
BougieRef1 = security (tickerid, TF1, src)

// Size of the EMA
ema_length1 = 3
ema_length2 = 9

// Calculation of EMA
ema1 = ema (src, ema_length1)
ema2 = ema (src, ema_length2)

// Calculation of EMAs taking into account the unit of time
mtfema1 = security (tickerid, TF1, ema1)
mtfema2 = security (tickerid, TF1, ema2)

// Calculation of EMA delta in UT + minimal smoothing
disp1 = security (tickerid, TF1, (mtfema1-mtfema2 + (src + src + src [1]) / 3)) // Smoothing, closer to FXCM like that
delta1 = security (tickerid, "D", (src * display1))

// Exit
colorCond1 = mtfema1-mtfema2> 0? lime: red // Green display when EMA 3> EMA 9, red otherwise

// Outputs display
plot (disp1-delta1, color = colorCond1, style = columns, transp = 0, editable = true) // Result - Output trimming as a graph
Re: averages_histogram
Apprentice · Sun Nov 24, 2019 8:51 am
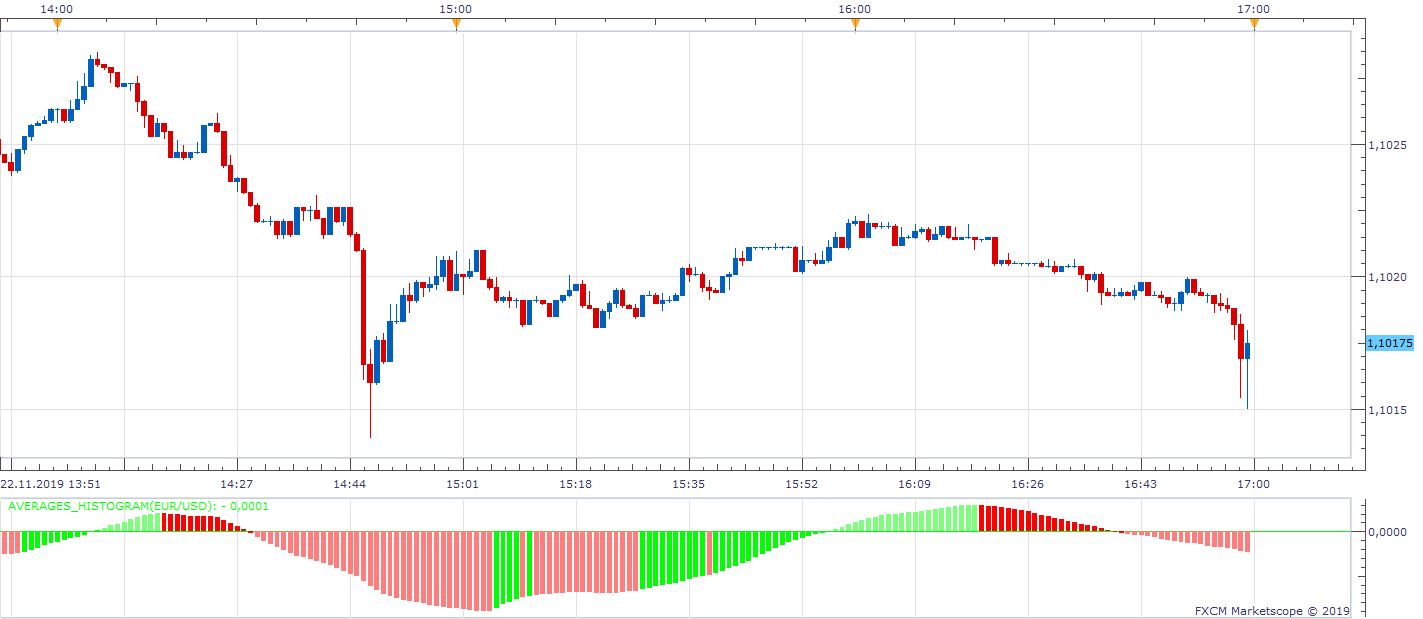
Try to use a different browser/computer during download. It seems you have a previous version of the indicator in your buffer.
Re: averages_histogram
bruno2017 · Mon Nov 25, 2019 5:19 am
Hello here is the real code, can you turn it into lua. thank you https://textuploader.com/1o0q3
Re: averages_histogram
Apprentice · Mon Nov 25, 2019 6:54 am
Your request is added to the development list. Development reference 355.
Re: averages_histogram
Apprentice · Tue Nov 26, 2019 5:29 am
Your url redirects to the Lua code.
Re: averages_histogram
bruno2017 · Tue Nov 26, 2019 5:49 am
yes, how can I install it on the TS?
Re: averages_histogram
Apprentice · Tue Nov 26, 2019 11:39 am
You can download from this topic. viewtopic.php?f=17&t=1589 Installation instruction. viewtopic.php?f=17&t=59681
Re: averages_histogram
bruno2017 · Tue Nov 26, 2019 11:59 am
the lua code that is related, that I have provided or can I download?
Re: averages_histogram
Apprentice · Tue Nov 26, 2019 12:18 pm
The code you have provided is available for download here. viewtopic.php?f=17&t=1589
Re: averages_histogram
bruno2017 · Tue Nov 26, 2019 2:38 pm
ok I thought that code would create a histogram indicator. grieve