fxcodebase-backup
B-Line
Source: https://fxcodebase.com/code/viewtopic.php?f=17&t=61361
Forum: 17 · Topic 61361 · 7 post(s)
B-Line
Apprentice · Thu Oct 23, 2014 4:24 am
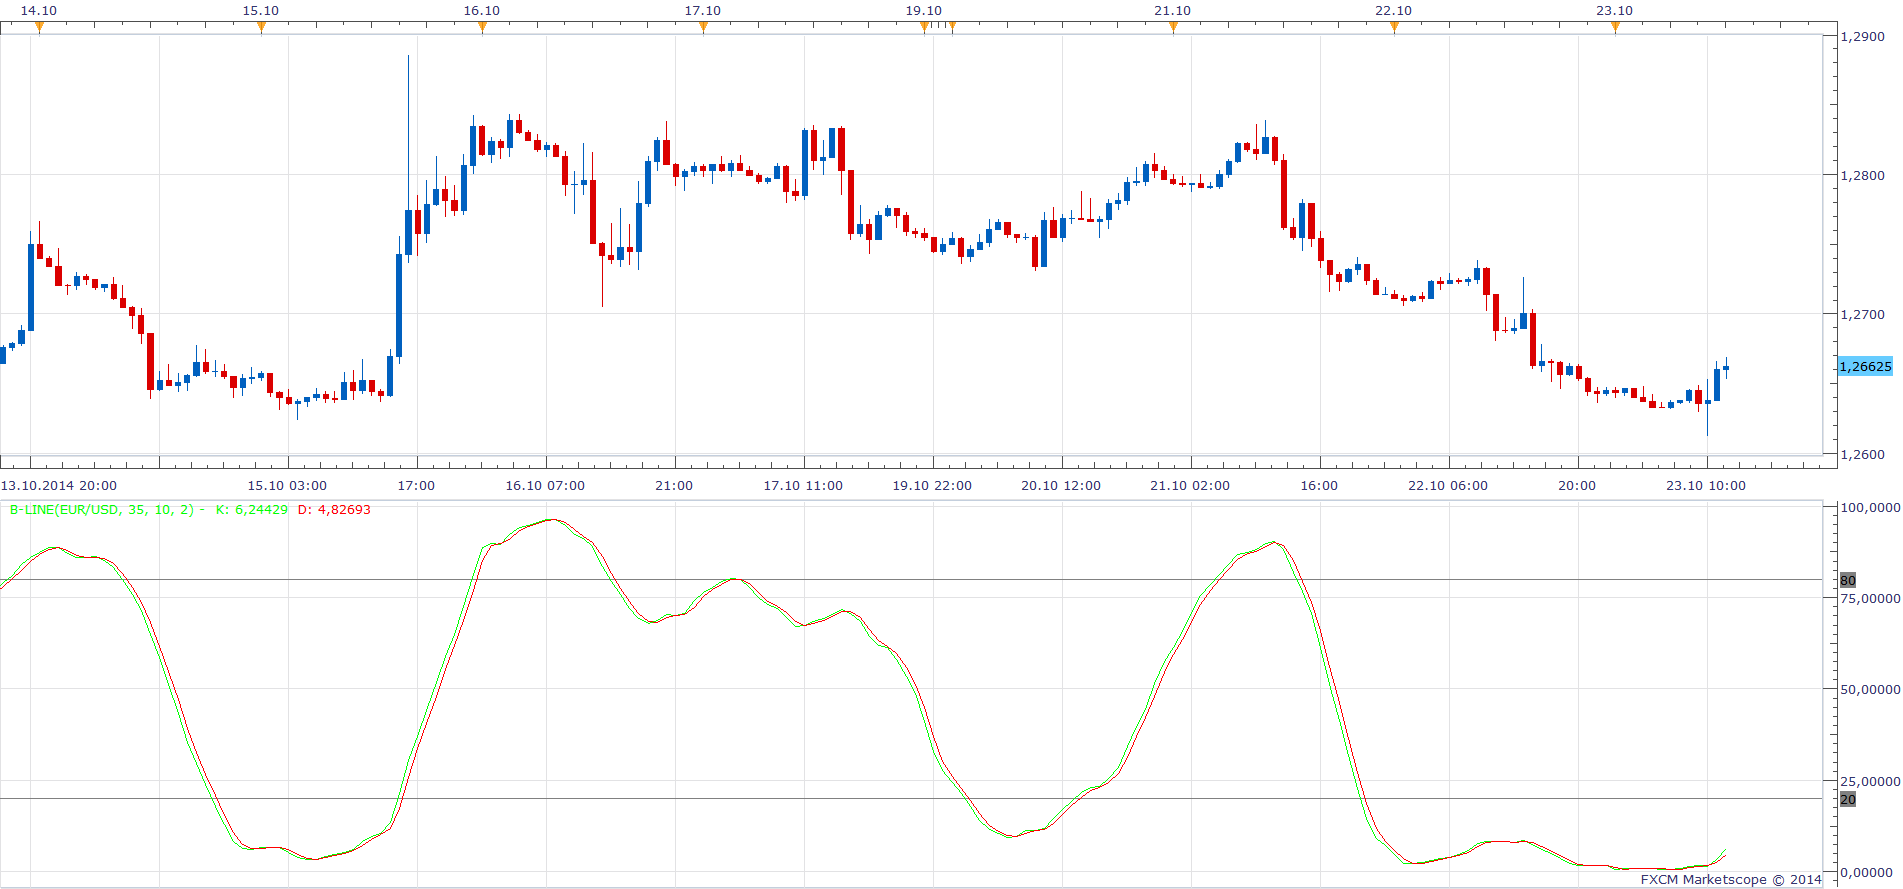
Based on the request. viewtopic.php?f=27&t=61352
The indicator was revised and updated
Re: B-Line
md2324 · Tue Oct 28, 2014 12:04 pm
Hi Apprentice, thank you so much for coding the B-line Indicator. I really appreciate that
I had a quick question please, relating to the Indicator….
I have attached 3 different screen shots of the Two sets of Stochastics that I would like to have super-imposed onto the same sub-window as the B-Line ( if that would be possible )
The Stochastics settings are…. 9,3,3 and 5,3,3
And if the coding wouldn’t be to problematic, could we make the Stochastics with the “ Ribbon “ look to them, if this can be implemented via MarketScope ?
Thanks again for all the help and coding, Can’t thank you enough - Michael
Re: B-Line
Apprentice · Wed Oct 29, 2014 4:19 am
Can u provide higher resolution screen shot, or better yet working MT4 indicator.
Re: B-Line
md2324 · Fri Nov 07, 2014 1:52 pm
Hi Apprentice, I uploaded another screenshot of the Indicator ( emphasis on the Stochastics )
If you need further detail or more screenshots , please don’t hesitate to let me know
And thank you again, I really appreciate all of your help with this Indicator
Thanks again - Michael
Re: B-Line
Apprentice · Sat Nov 08, 2014 6:05 am
Unfortunately, this is not enough information for me to start to work on this task. I need a clear description or example of implementation for another platform.
Re: B-Line
md2324 · Thu Jan 15, 2015 1:48 pm
Good afternoon, I went back on the NT forums and found some more information on the topic of the B-Line , and am hoping that what I have found, will allow for the implementation of the 2 ‘ Rainbow “ stochastics to be super-imposed on the same sub-window as the B-Line is
Here’s what I found…..
the B-line, which is a kind of LT stochastic indicator, this is the TS code of the B-line…..
Input: Price(Close), Length1(35), Length2(10), Length3(1), OverBought(80), OverSold(20), MidColor(White),OBOSColor(Red); Variables: KFast(0), KFull(0), DFull(0), LL(O), HH(0); LL = Lowest((High+Low)/2, Length1); HH = Highest((High+Low)/2, Length1); KFast = 100 * IFF(HH-LL=0,0,(((High+Low)/2) - LL)/(HH- LL)); KFull = Average(KFast, Length2); DFull = Average(KFull, Length3); If KFull <= 80 and KFull >= 20 then Plot1(KFull,”Stoc”,MidColor,Default,2) else Plot1(KFull,”Stoc”,OBOSColor,Default,2); Plot3(OverBought, “OverBought”); Plot4(OverSold, “OverSold”);
I have also attached 2 of the template files, as well as a screenshot of all the Individual Indicators and their settings
Hopefully this will help and make the coding in adding the Stochastics to the B-Line easier
Apprentice, as always, Thanks so much appreciate all you do
Re: B-Line
Apprentice · Sun Jul 02, 2017 12:55 pm
The indicator was revised and updated.