fxcodebase-backup
Bid Ask Volume
Source: https://fxcodebase.com/code/viewtopic.php?f=17&t=68869
Forum: 17 · Topic 68869 · 16 post(s)
Bid Ask Volume
Apprentice · Sun Sep 01, 2019 6:28 am
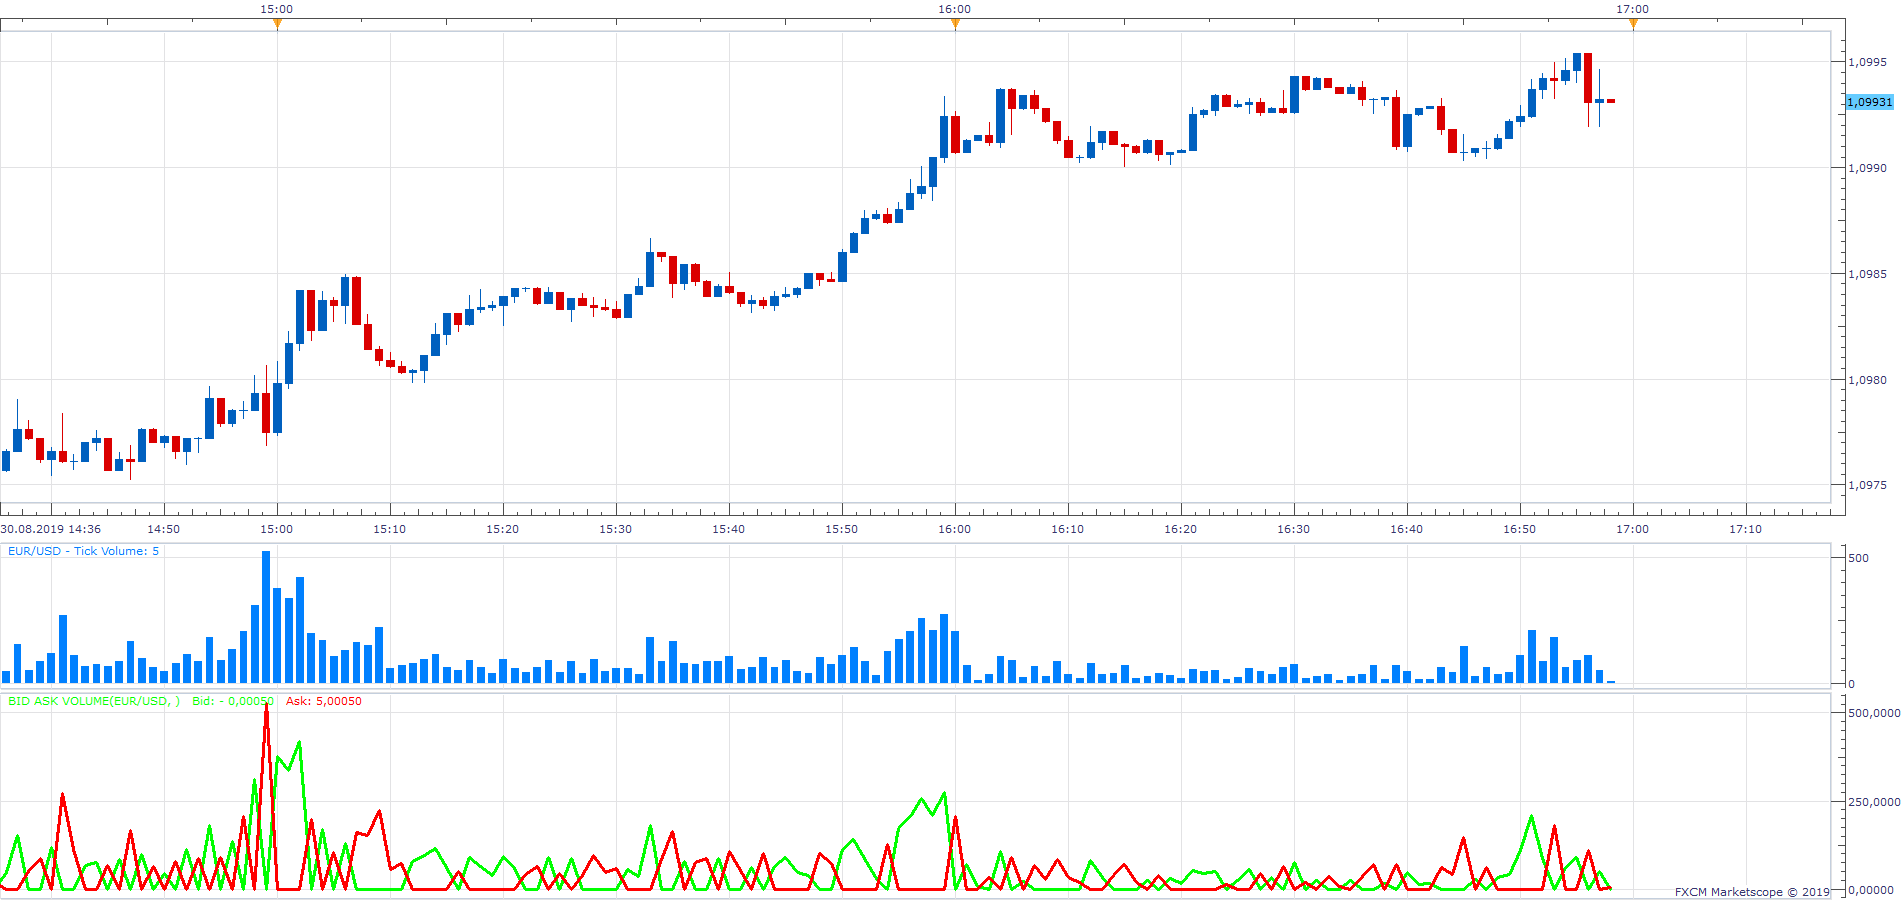
Based on request. viewtopic.php?f=27&t=68861
Re: Bid Ask Volume
cheeetah · Sun Sep 15, 2019 7:02 am
Greetings Apprentice! Thanks for dedicating the time to the indicator. I’ve been busy,but I took time to review it.Here are my conclusions: 1)The indicator shows negative bid,negative ask. 2)The indicator shows more volume that it is counted. 3)The indicator seems to to do incorrect calculations. Below you’ll find the screenshots of the above and my calculations of the above examples in an excel sheet. Should you need a full sample calculation of bid/ask vol,you ll find it below as well. Thanks again!
Re: Bid Ask Volume
Apprentice · Mon Sep 16, 2019 3:35 am
Your request is added to the development list. Development reference 91.
Re: Bid Ask Volume
cheeetah · Tue Oct 01, 2019 7:20 am
Greetings Apprentice! Sorry for the delay,but I reviewed the indicator once again. The problem that i came up mostly is that when the candle is bullish,it shows ask vol>bid vol and vice versa. You can find my calculations vs what the indicator shows below and a screenshot. Should the calculations be unclear here is the example: Suppose I have a candle with O:1.0887 H:1.08950 C:1.08928 L:1.08846 VOL:12836. Step1:Get the range of the bar =H-L Step2:Get the body of the bar as % of the range X=(C-O)/(H-L) (where X is expressed as % of total) Step 3:Divide the VOL by (2-X) to get the bid volume.The difference between vol and bid vol=askvol. Now,if i am correct,you did this: Bid VOL=X * VOL,hence the incongruencies.I did upload an excel sheet with the wrong method of calculation,so pardon me for that. Again,the you can compare the calculations in the sheet below. Many thanks for your time and effort Kind regards
Re: Bid Ask Volume
Apprentice · Wed Oct 02, 2019 5:38 am
Your request is added to the development list. Development reference 144.
Re: Bid Ask Volume
Apprentice · Wed Oct 09, 2019 1:45 pm
Try this version.
Re: Bid Ask Volume
cheeetah · Fri Oct 11, 2019 12:00 pm
Greetings again the indicator shows bid ask greater than the total volume and it shows negative bid/negative ask as seen below. I thank you for your time and effort devoted to this.again,please have a look at this logic on this: 1)Find the range of the bar RANGE=HIGH-LOW 2)Find the % range (body of the bar in relation to the range) %B=(CLOSE-OPEN)/((High-Low)) 3)Division Volume/(2 - %B) == bid volume ask volume == volume - bid volume I think the 3rd part is proving the most difficult. I hope you hear me right and get it right cheers and thanks again.
Re: Bid Ask Volume
Apprentice · Sat Oct 12, 2019 5:01 am
Try this version.
Indicator based strategy. viewtopic.php?f=31&t=69042
Re: Bid Ask Volume
cheeetah · Wed Oct 16, 2019 4:37 am
YEP,that’s brilliant. Thank you very much for the time and effort!
Re: Bid Ask Volume
ASTERIA · Sun Oct 20, 2019 9:12 am
Hi apprentice, can you make a simple strategy with this indicator?
Buy: if bid> ask (end of turn / live) Sell: if ask> bid (end of turn / live)
Thank you
Re: Bid Ask Volume
Apprentice · Mon Oct 21, 2019 5:02 am
Your request is added to the development list. Development reference 226.
Re: Bid Ask Volume
ASTERIA · Mon Oct 21, 2019 9:09 am
Hi apprentice, I would like for the strategy to use the version of indicator at Sat. Oct 12, 2019 Thank you
Re: Bid Ask Volume
Apprentice · Tue Oct 22, 2019 4:33 am
Indicator based strategy. viewtopic.php?f=31&t=69042
Re: Bid Ask Volume
mulligan · Wed Oct 30, 2019 9:36 am
Could we please get an alert added to the Sat Oct 12 version. Up when bid line crosses over ask line and down when ask crosses over bid. Live and end of turn options.
Thanks
Re: Bid Ask Volume
Apprentice · Thu Oct 31, 2019 6:06 am
Your request is added to the development list. Development reference 266.
Re: Bid Ask Volume
Apprentice · Fri Nov 01, 2019 7:23 am
Try this version.