fxcodebase-backup
Bill Williams Base Line
Source: https://fxcodebase.com/code/viewtopic.php?f=17&t=63877
Forum: 17 · Topic 63877 · 5 post(s)
Bill Williams Base Line
Apprentice · Sun Sep 18, 2016 4:10 pm
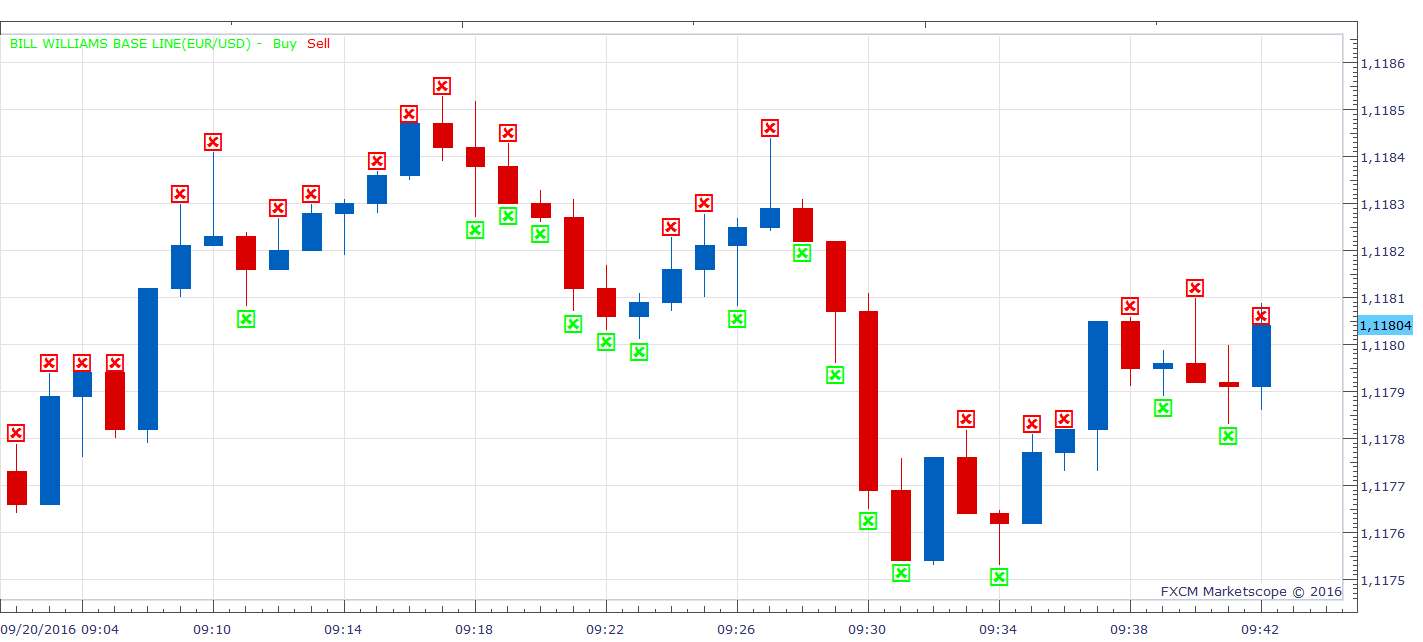
The idea of the fifth dimension: •Buyers are weaker on the “b” bar in comparison to the “a” bar. It proves that the “b” bar’s high is lower than the “a” bar’s high. •Why are sellers stronger on the “b” bar? The reason for this is that new information came to the market (on the picture it is shown as a dashed square) and changed the balance. •If buyers become stronger and raise the market (refer to the “c” bar) to the “a” bar’s high, this means that the market balance is changing and it may be a first signal to make a deal within the fifth dimension. Bar “b” is the base bar: •Base bar for a signal to buy is the most recent bar whose high is lower than the preceding bar’s high (“b” bar in the figure above). It may be the current bar; for example, “b” bar when there is no “c” bar yet. •Base bar for a signal to sell is the most recent bar whose low is higher than the preceding bar’s low (it may be the current bar).
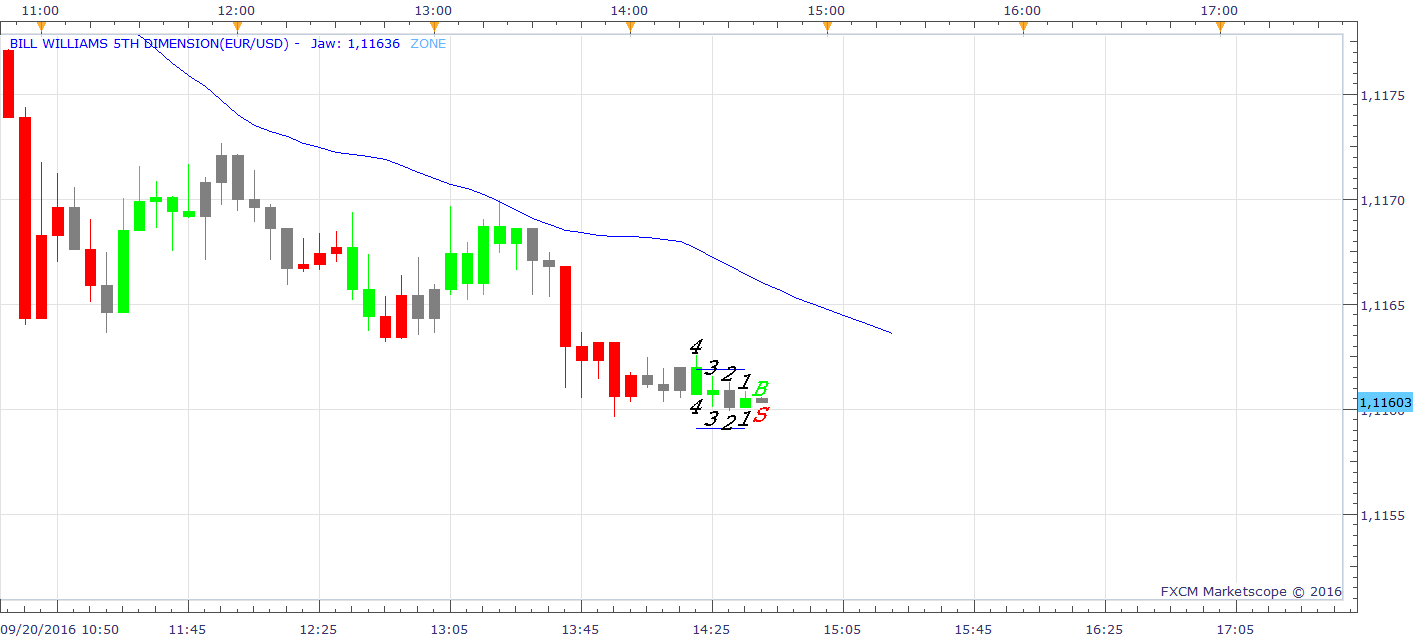
Bill Williams 5th Dimension.lua
Materials on this is a bit sketchy. I will appreciate any help.
Re: Bill Williams Base Line
Apprentice · Tue Sep 20, 2016 2:28 pm
Bill Williams 5th Dimension.lua Added.
Re: Bill Williams Base Line
Apprentice · Mon Aug 28, 2017 3:39 am
The indicator was revised and updated.
Re: Bill Williams Base Line
mayk01 · Wed Nov 15, 2017 5:10 am
Hi, I do not exactly understand the function of the two lines. Min or max driving probability in 5 th dimension ?
Regards, Mayk
Re: Bill Williams Base Line
Apprentice · Mon May 07, 2018 12:32 pm
The Indicator was revised and updated.