fxcodebase-backup
Blended Momentum
Source: https://fxcodebase.com/code/viewtopic.php?f=17&t=75802
Forum: 17 · Topic 75802 · 1 post(s)
Blended Momentum
Steve_W · Sat Apr 05, 2025 3:18 pm
Inspired by ideas of Linda Raschke where she sometimes uses multiple timeframe momentum oscillators to gauge a market https://www.youtube.com/watch?v=NDg0VZFvFXU This work develops further into a flexible custom indicator
The indicator averages a number of different period momentum indicators (selectable from “ROC”, “RSI”, “CMO”, or “User Defined”) For “User Defined Momentum Indicator”, enter the required indicator name and “User Defined Offset” value to ensure output is symmetrically bipolar “DETERMINISTIC BOLTZMANN APPROXIMATION” is a given recent example - it has first to be installed to use it The number of indicators and their periods is defined with a “,” or “ “ delimited list of periods For example: Blended ROC = [ROC(2)+ROC(3)+ROC(4)+ROC(5)+ROC(6)]/5, is defined by setting “Periods List” to “2,3,4,5,6” Blended momentum is displayed as either a histogram or line oscillator - colour and shading representing direction and slope
Optional other modes… “Momentum x Volume”: low volume periods are de-emphasized where a momentum indication may have less meaning “Max-Min”: difference between highest momentum reading and the lowest for the list of indicators “Geometric Mean”: similar to RMS this averages the momentum - peaks might indicate extreme moves have occurred. Momentum direction is not indicated “Differentiated”: the slope of the momentum - similar to acceleration, and momentum being velocity “Integrated”: the momentum is re-integrated to give a synthetic price curve - the function includes a decay parameter to keep the signal bipolar “Separate Indicators”: all indicators overlaid - look for convergence (entry area) and spreading (exit area - or possibly reverse) as Raschke explains
Examples below are EUR/USD on 1H
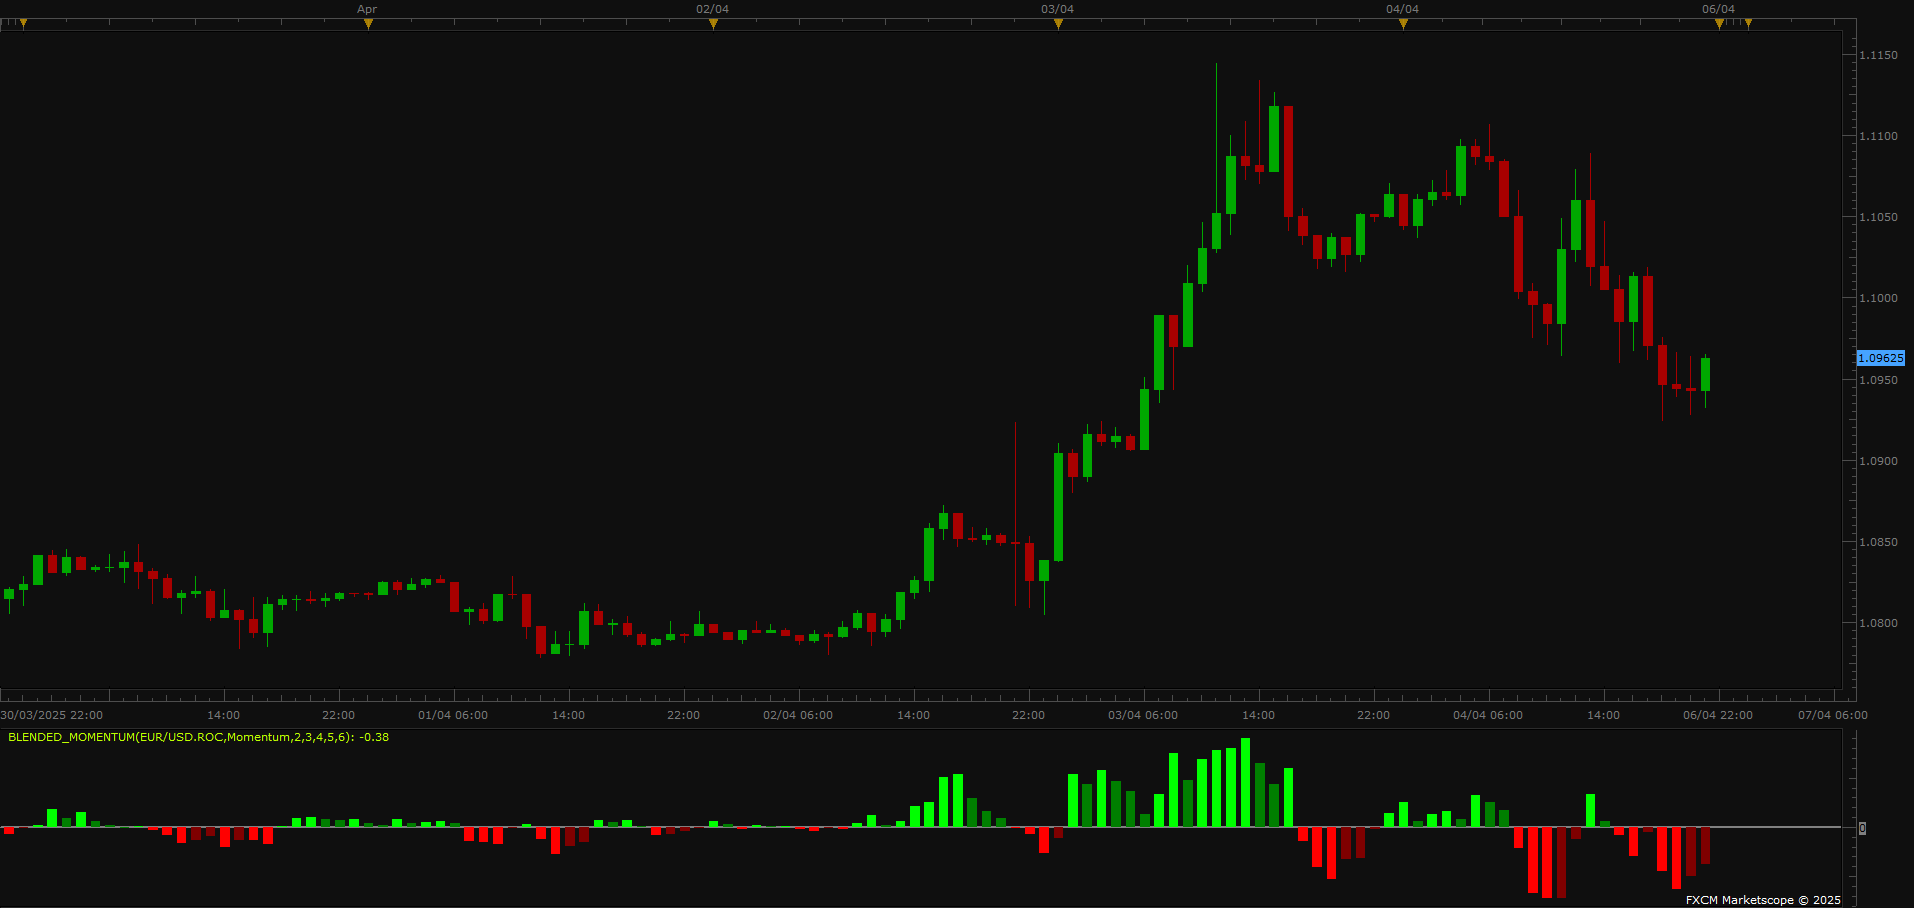
default settings
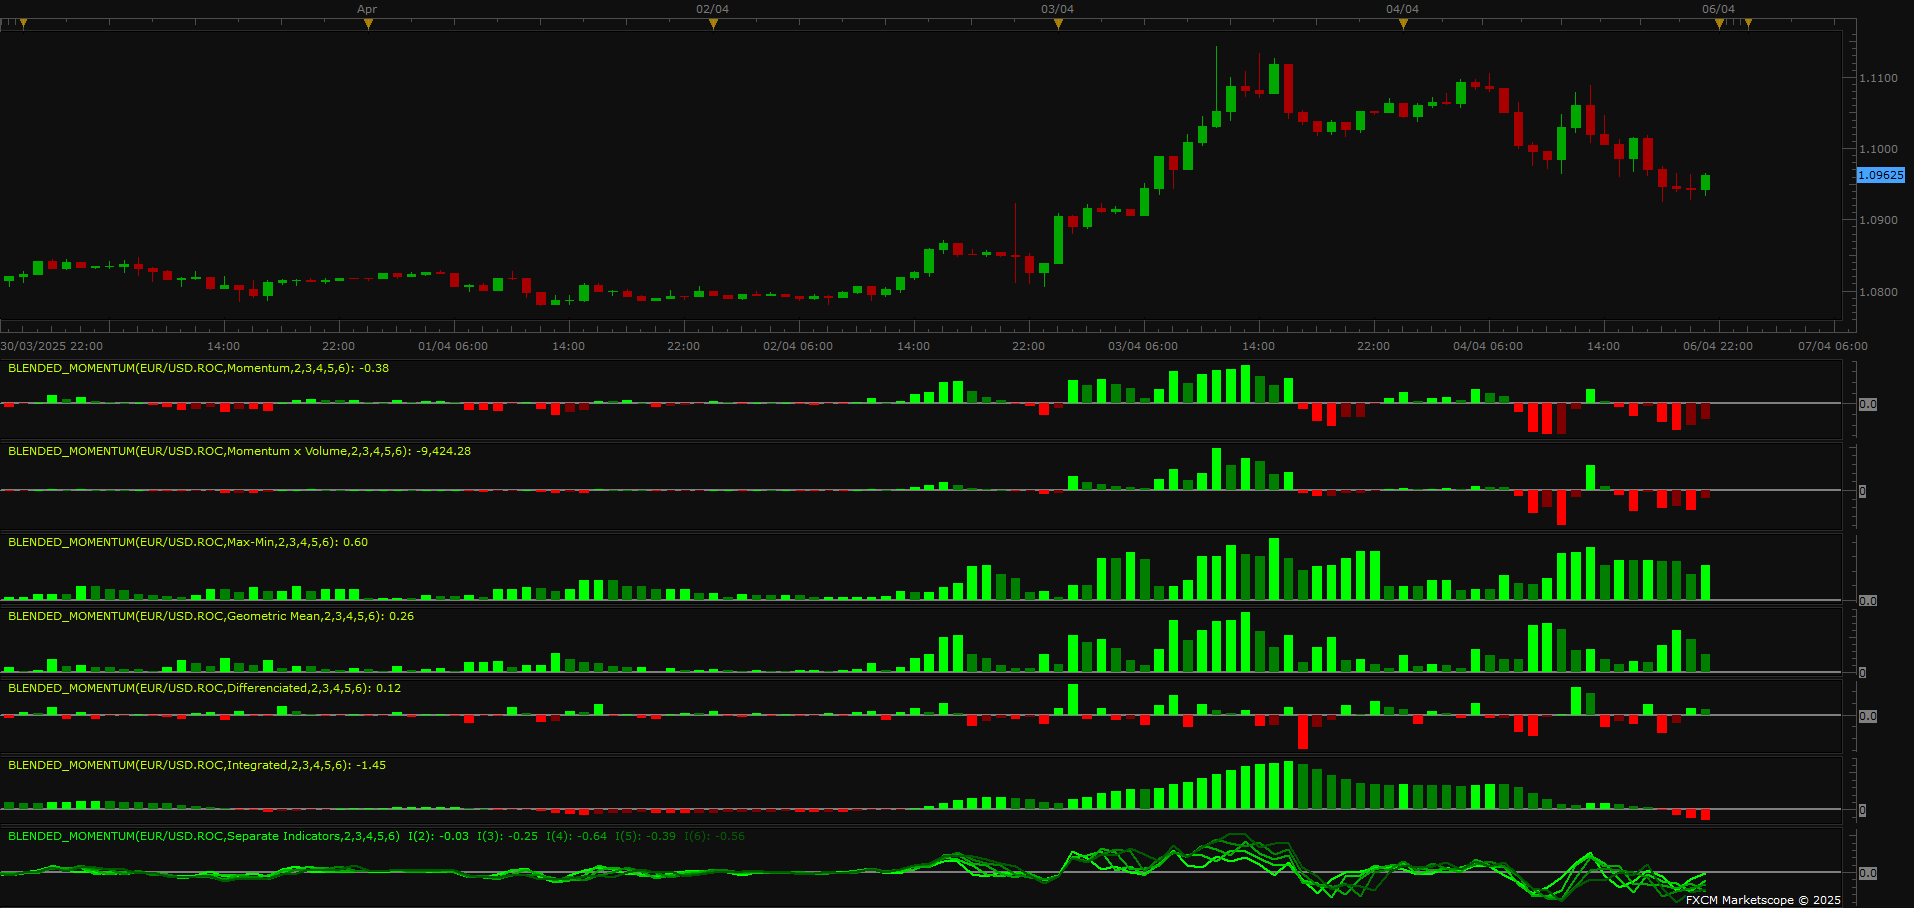
7 modes shown in multiple instances