fxcodebase-backup
Bollinger lows
Source: https://fxcodebase.com/code/viewtopic.php?f=17&t=72651
Forum: 17 · Topic 72651 · 4 post(s)
Bollinger lows
Apprentice · Mon Aug 22, 2022 5:38 am
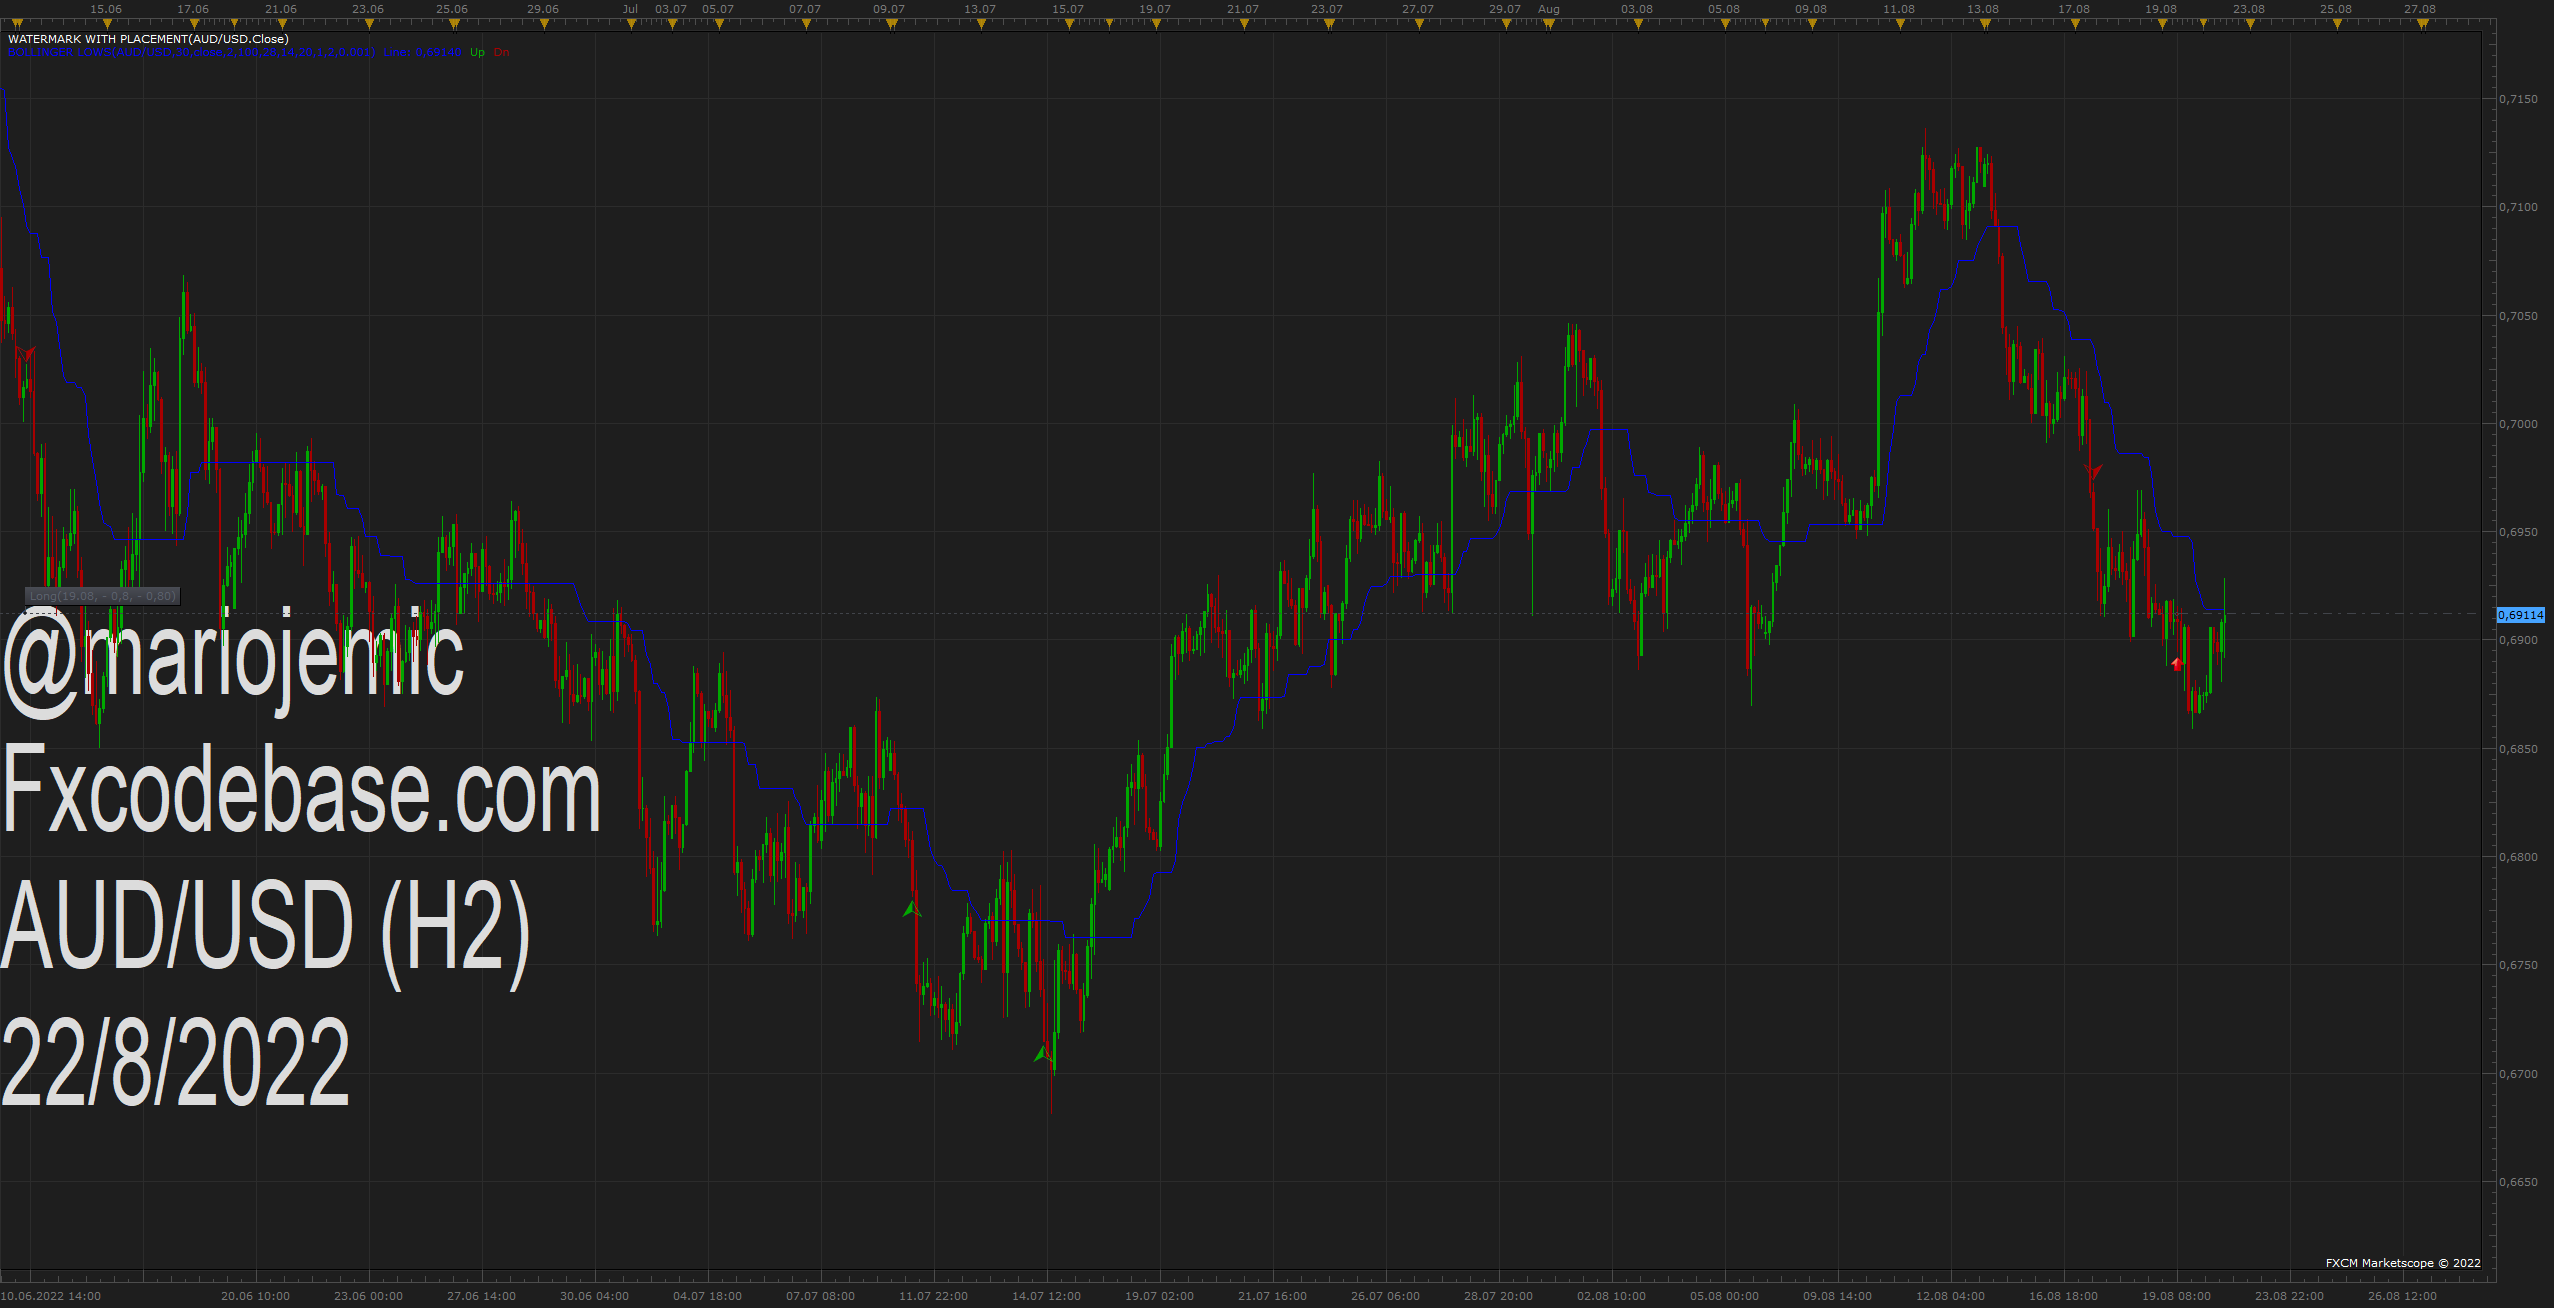
Based on the request. https://fxcodebase.com/code/viewtopic.p … 66#p147166
Re: Bollinger lows
TLBshifted · Fri Sep 16, 2022 4:43 am
Thanks Apprentice
Re: Bollinger lows
bartwas1 · Wed Sep 28, 2022 4:08 am
Hi
I like this bollinger lows indicator, so I have built a strategy. I’m testing it with momentum indicator and two slope indicators and other useful stuff. See below. The strategy is very simple - alignment between slope indicators, momentum and bollinger lows. For short trades set up is as follows:
- slopes are angling down - red colour on the chart (slow and fast) settings: fast 22, slow 70
- momentum falls below zero settings: 10,14,20, here used only 20 for smoothing
- bollinger lows is above entry price settings as in original build by Apprentice. Obviously long trades are the opposite. Slopes need to be facing up (colour green both), momentum goes above zero and bollinger lows indicator is below an entry price. Last thing is a filter - MACD with standard settings 12,26,9 on current chart or a higher time frame (with ratio 1:3 or 1:4 meaning 5m to 15m or 15m to 1h). There are two options for filtering the price and making the entry more reliable. Settings for higher time frame are different - 6, 13 and 5. My preference is naturally higher time frame. MACD filter is to prevent some price turns and twist before choosing direction. Filter works as follows - MACD line (red on the chart) needs to be above signal line (navy blue) and going above zero level for long trading zone and if MACD line goes below signal line and zero level then it indicates short zone. Beware of sideways market! Don’t forget about stop orders! Charts (5m and 15m) below illustrate how this strategy looks with MACD set for higher frame. There some other elements, but not used in the strategy. Testing now.
Re: Bollinger lows
bartwas1 · Thu Oct 06, 2022 2:25 am
Hi
I have tweaked this strategy I’ve proposed by changing MACD settings into 24,52,18 and used default chart as a data source. Secondly I’ve added a new oscilator - Waddah Addar’s volume with original settings plus two ARSI indicator superimposed. First one - a fast one (blue, 5) and second ARSI, a slower one (rusty orange, 21). When fast ARSI crosses slow one on the way upwards, it indicates rising volume (not price direction though in this case bars a dead giveaway) which is good for trading (short or long positions). Bear in mind of the chart’s time frame - the lower it is the smaller impact. High volume influences trading - makes trades likely to be more sustainable. That’s the reason for this extra layer in the strategy.
See chart below for illustrating purposes. Have fun trading. Best wishes - Bart.