fxcodebase-backup
CM-RSI
Source: https://fxcodebase.com/code/viewtopic.php?f=17&t=66844
Forum: 17 · Topic 66844 · 5 post(s)
CM-RSI
Apprentice · Fri Oct 19, 2018 6:12 am
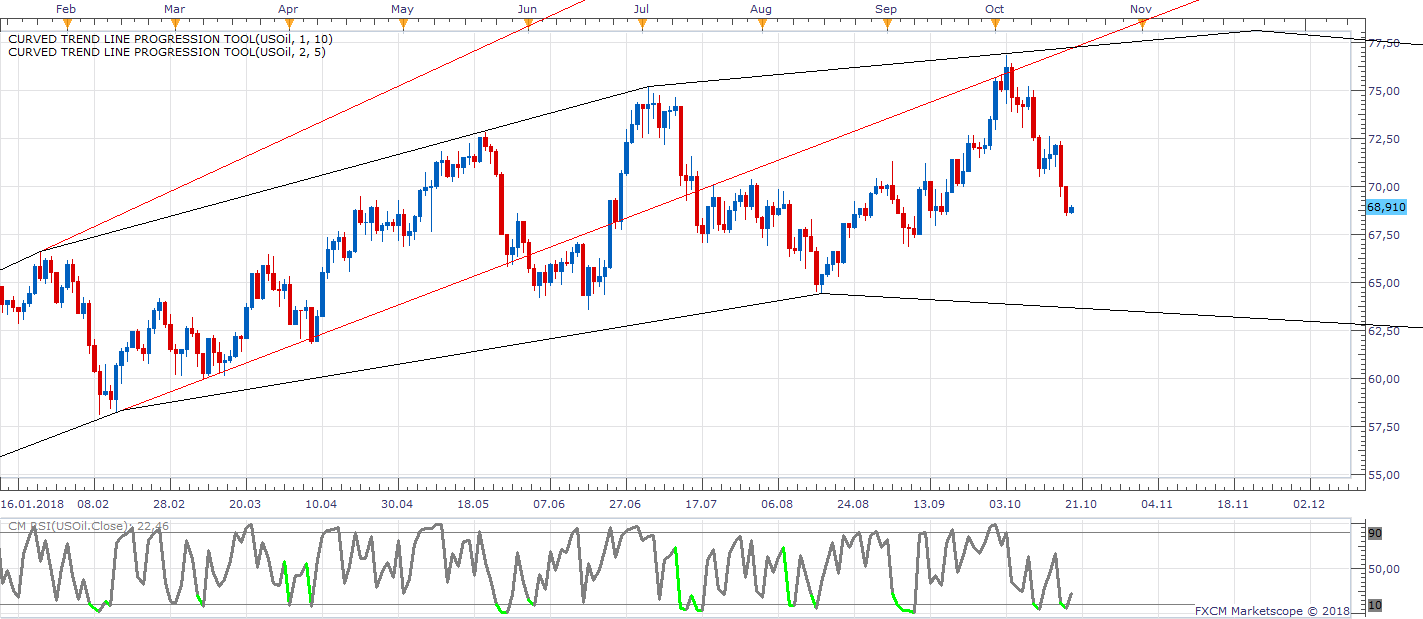
Based on Larry Connors’ RSI-2 system. It is a short-term trading strategy. The average length of time in a trade is just over 2 days. The RSI-2 Strategy is designed to use on Daily Bars
Re: CM-RSI
papynou34 · Fri Nov 23, 2018 5:47 am
Hello, Is there a stratégy based upon this indicators?
Thanks
Re: CM-RSI
Apprentice · Sat Nov 24, 2018 6:14 am
Sure. Can you provide Long/Short/Exit rules?
Or can I use this.
Have found this on the net. https://stockcharts.com/school/doku.php … egies:rsi2
Traders should look for buying opportunities when above the 200-day SMA and short-selling opportunities when below the 200-day SMA.
Connors found that returns were higher when buying on an RSI dip below 5 than on an RSI dip below 10.
For short positions, the returns were higher when selling-short on an RSI surge above 95 than on a surge above 90.
Waiting for the open gives traders more flexibility and can improve the entry level.
Exiting long positions on a move above the 5-day SMA and short positions on a move below the 5-day SMA.
Chartists should also consider setting a trailing stop or employing the Parabolic SAR.
Re: CM-RSI
papynou34 · Mon Nov 26, 2018 2:05 pm
Hello, Sorry for the delay in answering. Yes please use the rules you provide in the link. Thanks a lot in advance
Re: CM-RSI
Apprentice · Tue Nov 27, 2018 6:34 am
Try this version. viewtopic.php?f=31&t=67012&p=122375#p122375 If you will come up with any other rules, you will be happy to write it for you.