fxcodebase-backup
Consecutive candle range
Source: https://fxcodebase.com/code/viewtopic.php?f=17&t=60884
Forum: 17 · Topic 60884 · 13 post(s)
Consecutive candle range
Apprentice · Thu Jul 10, 2014 11:33 am
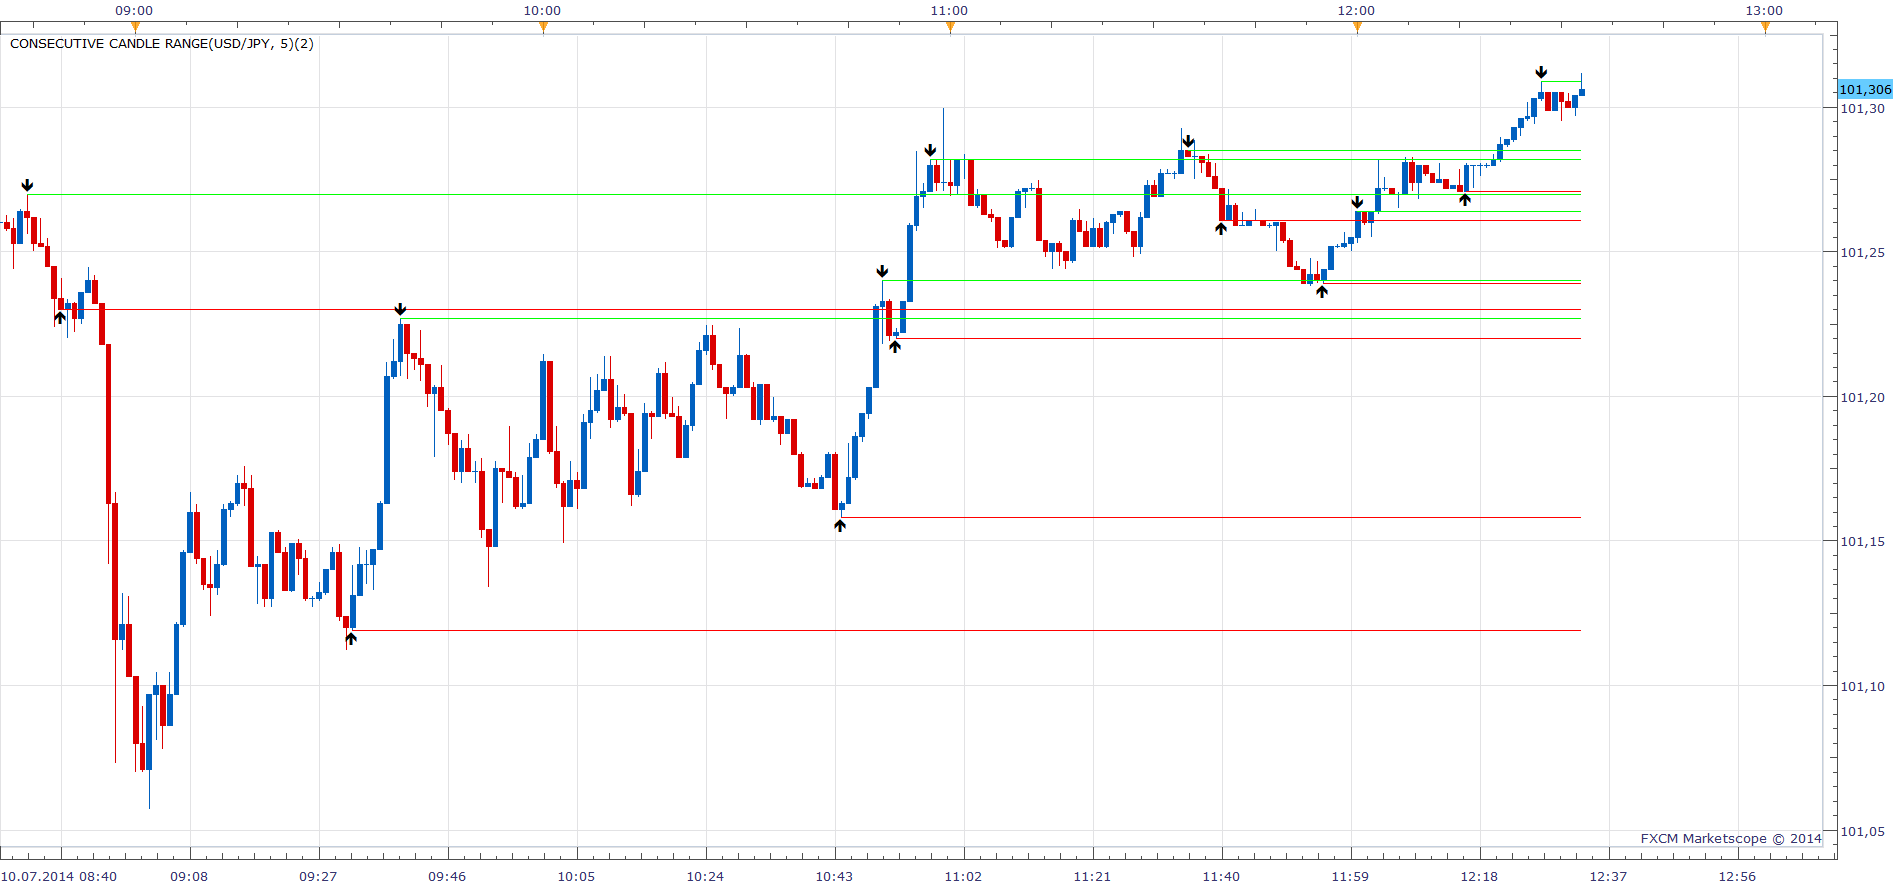
Based on requests viewtopic.php?f=27&t=60881
Will draw the line on Min / Max Level for a series of at least N Up/Down candles. By default N is set to 5
Consecutive candle range Tick Version.lua
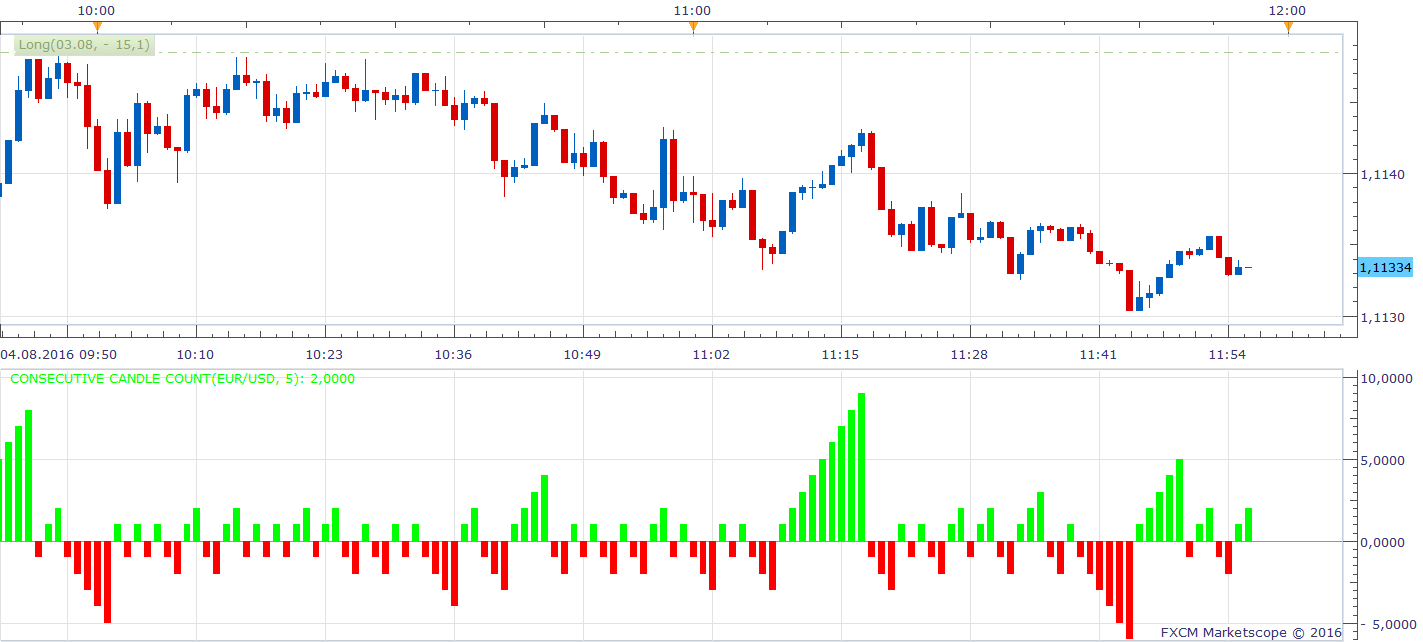
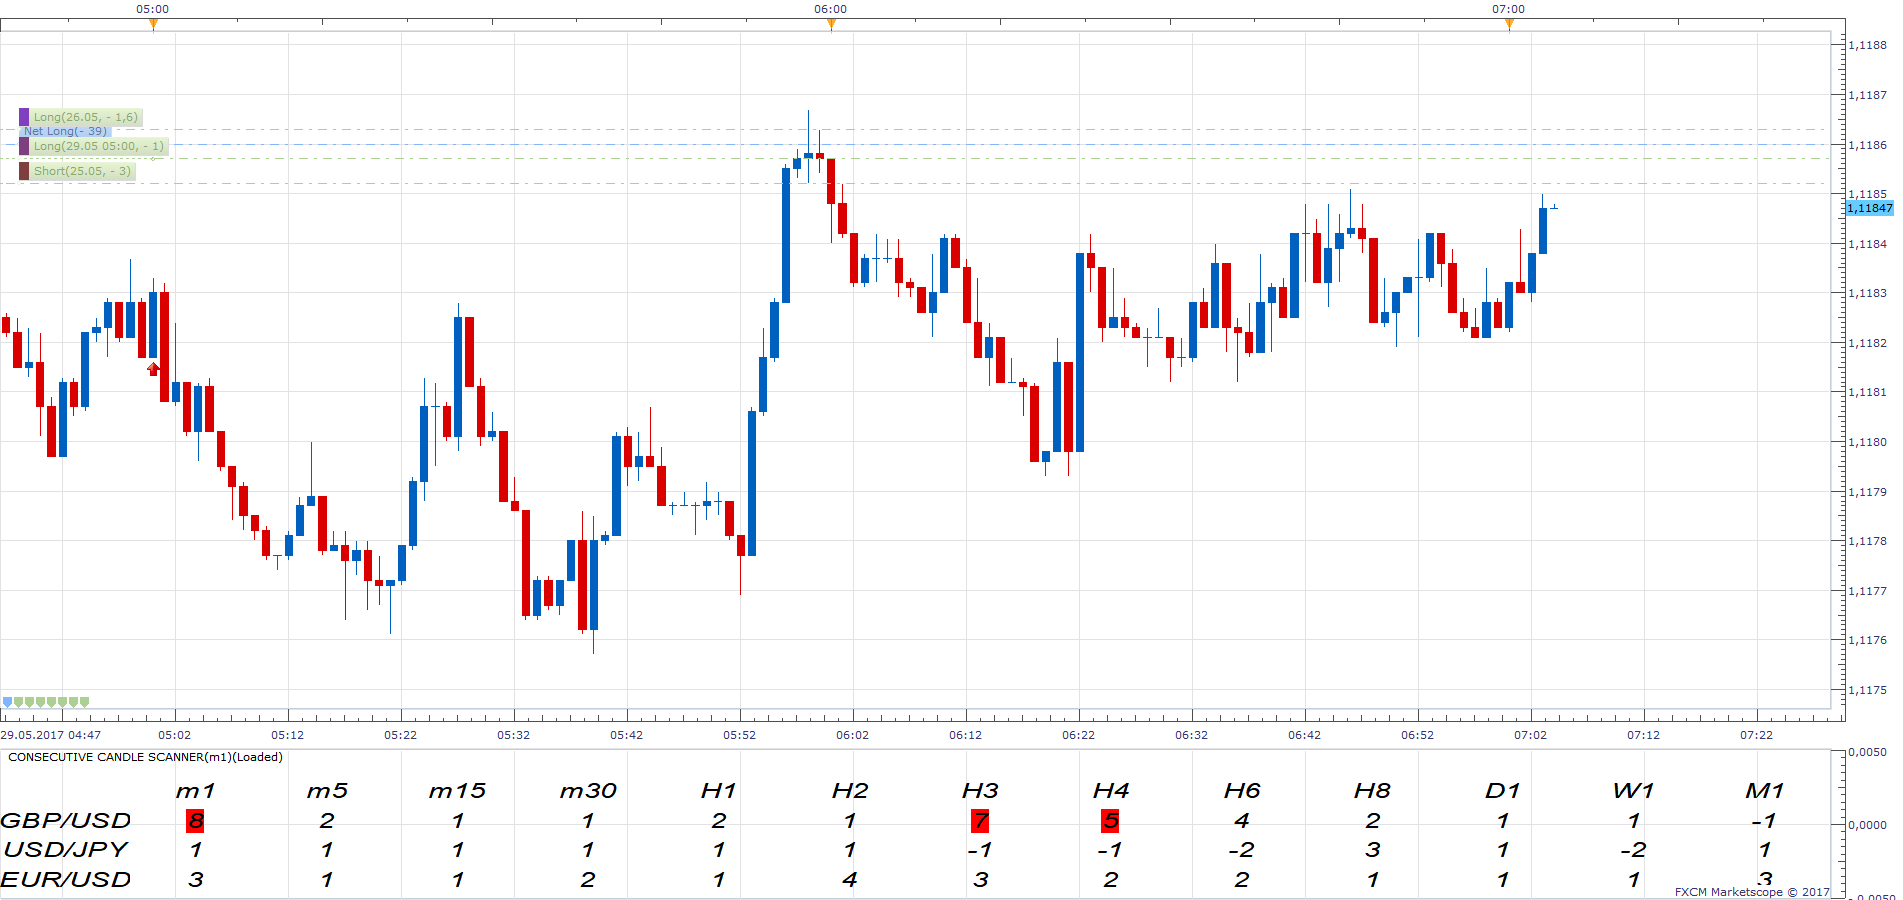
Consecutive Candle Scanner.lua
The indicator was revised and updated
Re: Consecutive candle range
Apprentice · Fri Jul 11, 2014 9:41 am
MQ4 version can be found here. viewtopic.php?f=38&t=60891
Re: Consecutive candle range
kankatrader · Mon Jul 14, 2014 2:50 pm
Hi Apprentice You can create a strategy for this indicator ?
Best regards
Re: Consecutive candle range
Apprentice · Tue Jul 15, 2014 2:32 am
Can you describe, specify the Buy / Sell / Exit conditions.
Re: Consecutive candle range
Cactus · Sun Jul 31, 2016 4:21 pm
This is useful. Can it also show those levels even if the past price isn’t visible on the chart? As price moves forward and chart moves with it the older levels will start to disappear. Can it still keep them instead though? Like add a parameter to “scan for the last x periods” and take levels from that period, not just from what’s visible on the chart.
Re: Consecutive candle range
Apprentice · Tue Aug 02, 2016 6:50 am
Try it now.
Re: Consecutive candle range
Cactus · Tue Aug 02, 2016 2:25 pm
Excellent work. However, I would like to use this with tick charts as well. My vague attempts at achieving this will not work. I tried changing the indicator:requiredSource(core.Tick); from “Bar” This gives an error to do with line 82 So then I tried removing the “.close” and “.open” but that broke it.
What I have in mind is to be able to see the lines on a tick chart too, but using data from another soure (m1,m15,h1 etc) using period selector.
Or, another version which actually use tick data in its calculations too if possible?
Thank you
Re: Consecutive candle range
Apprentice · Wed Aug 03, 2016 3:39 am
Consecutive candle range Tick Version.lua added.
Re: Consecutive candle range
Cactus · Wed Aug 03, 2016 11:02 am
Works great Sir, good job, you are a nice human
Re: Consecutive candle range
Cactus · Wed Aug 03, 2016 11:25 am
I mean it works fine but suffers the same problem as I described in my first post in this thread. Which is, as the chart move forward, the levels from the past disappear. And I would like them to stay as they are still relevant to me. That’s on the tick chart. Can you update it accordingly please thank you.
Re: Consecutive candle range
MC. Trend Trader · Wed Aug 03, 2016 1:34 pm
Can we have a Strategy for this Tick version indicator?
Up Arrow = open Buy position Down Arrow = open Sell position
Thanks in advance
Re: Consecutive candle range
Apprentice · Thu Aug 04, 2016 12:00 pm
Try this version. viewtopic.php?f=31&t=63734
Re: Consecutive candle range
Apprentice · Mon May 29, 2017 6:44 am
Indicator was revised and updated.