fxcodebase-backup
Correlations
Source: https://fxcodebase.com/code/viewtopic.php?f=17&t=3278
Forum: 17 · Topic 3278 · 4 post(s)
Correlations
Alexander.Gettinger · Fri Jan 28, 2011 11:35 pm
Indicator draw joint motion of two instruments. First at X axis and second at Y axis. Indicator automatically scales field of the drawing.
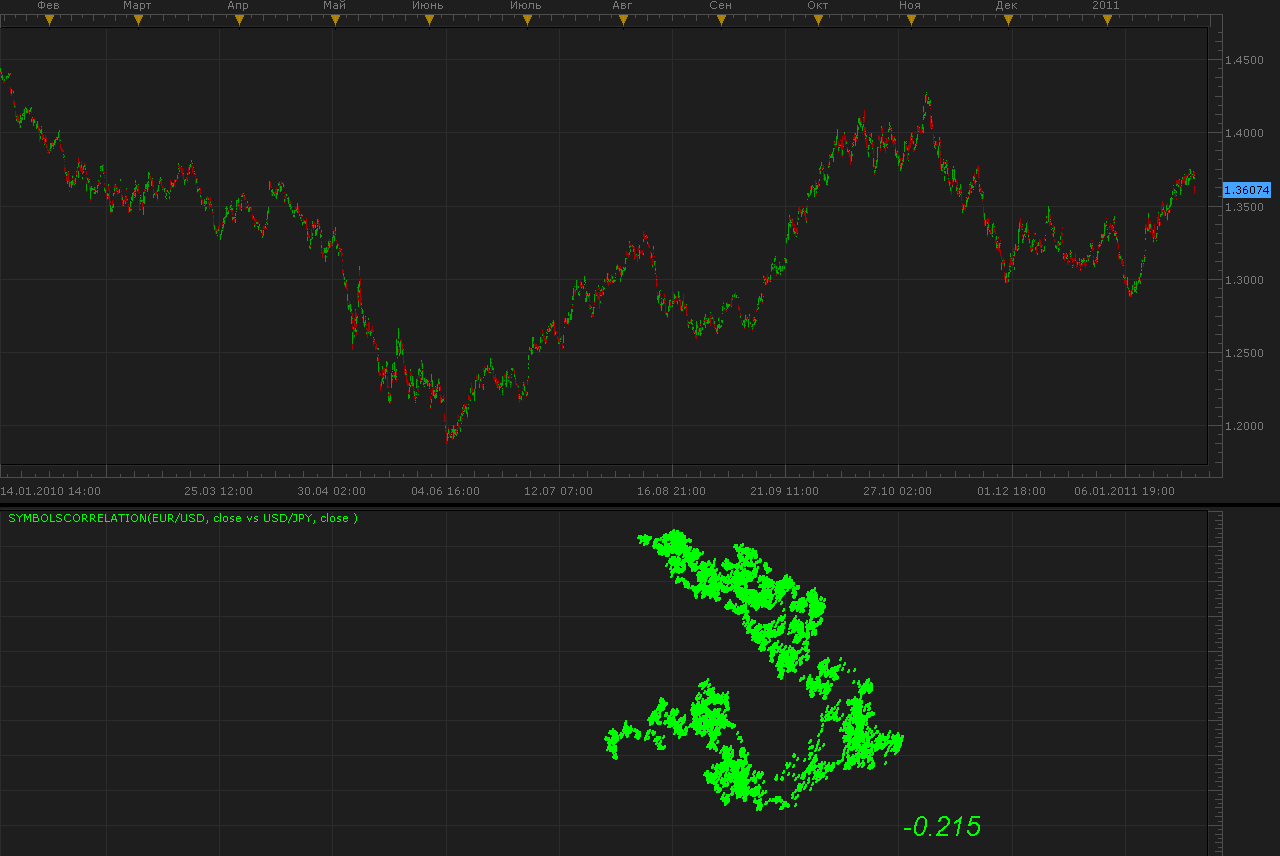
Also, the indicator calculates correlations coefficient (in right bottom corner).
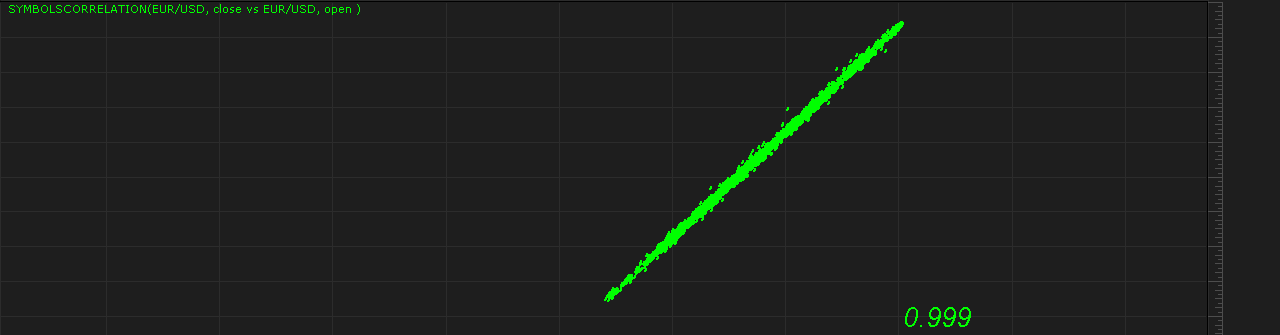
Examples. Very strong correlation between open and close prices of EUR/USD:
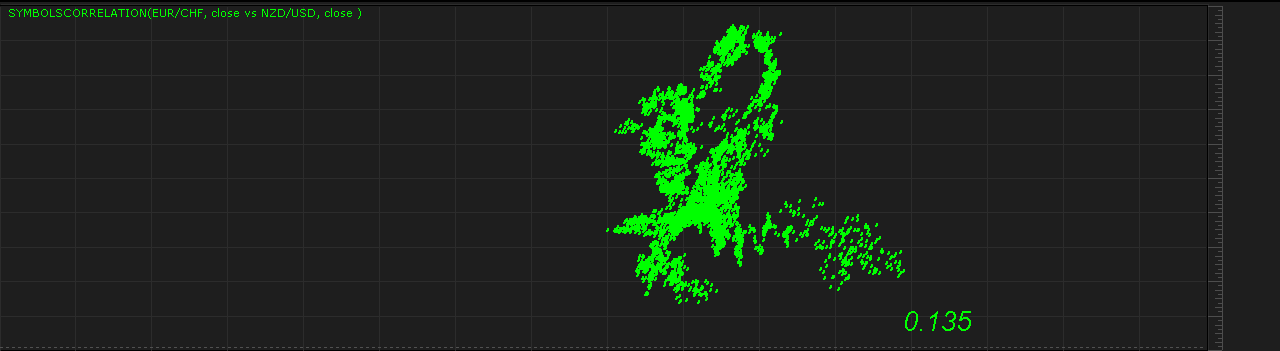
Very weak correlation between EUR/CHF and NZD/USD:
The indicator was revised and updated
Re: Correlations
Alexander.Gettinger · Fri Jan 28, 2011 11:37 pm
Negative correlation between USD/CAD and NZD/USD:
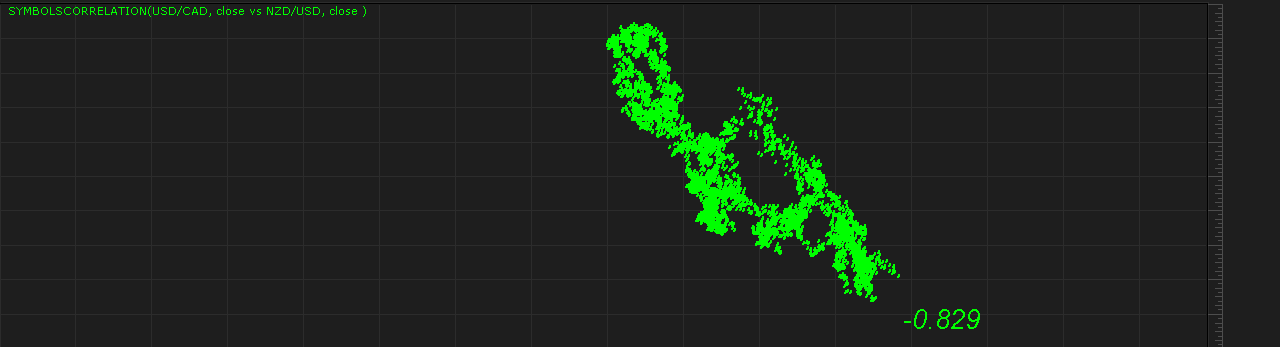
Important. Range of data corresponds to chart range.
Download:
I shall very pleased idea on development of this indicator.
Re: Correlations
antwoneeter · Wed Dec 14, 2011 5:15 pm
Great indicator. I’m curious to know why the dots line up closely in an ascending line/area when there’s a strong correlation. Are the prices over time compared on the X & Y axis? Maybe I should checkout the code…
Re: Correlations
Apprentice · Mon Mar 20, 2017 7:41 am
Indicator was revised and updated.