fxcodebase-backup
Cumulative Price Bar
Source: https://fxcodebase.com/code/viewtopic.php?f=17&t=3729
Forum: 17 · Topic 3729 · 4 post(s)
Cumulative Price Bar
Apprentice · Fri Mar 25, 2011 7:18 am
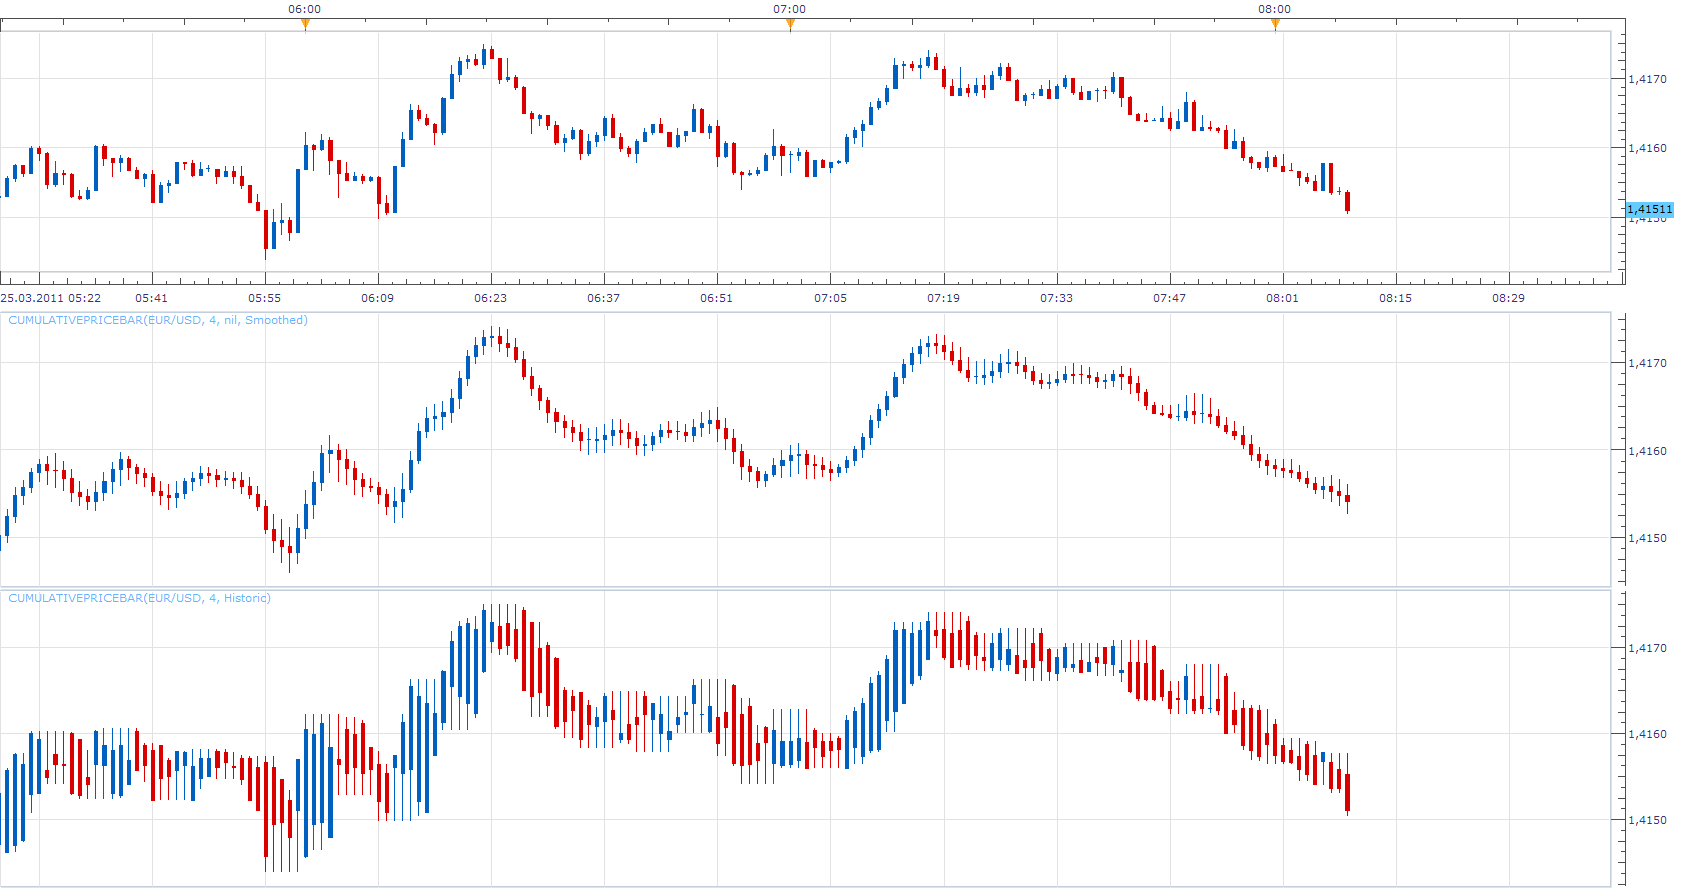
This indicator shows the Price action in the last N periods with a single candle.
There are two modes. Historic and Smoothed.
Smoothed Candles are formed on the basis of moving average of the last N periods of the individual components.
Historic Candles are formed, based on open, low, high, close values of the last N periods. If the period is zero, the indicator does not differ from the Main Chart Price Data.
To use Smoothed Mode you need to install Averages Indicator. You can find it here. viewtopic.php?f=17&t=2430&p=5268&hilit=averages#p5268
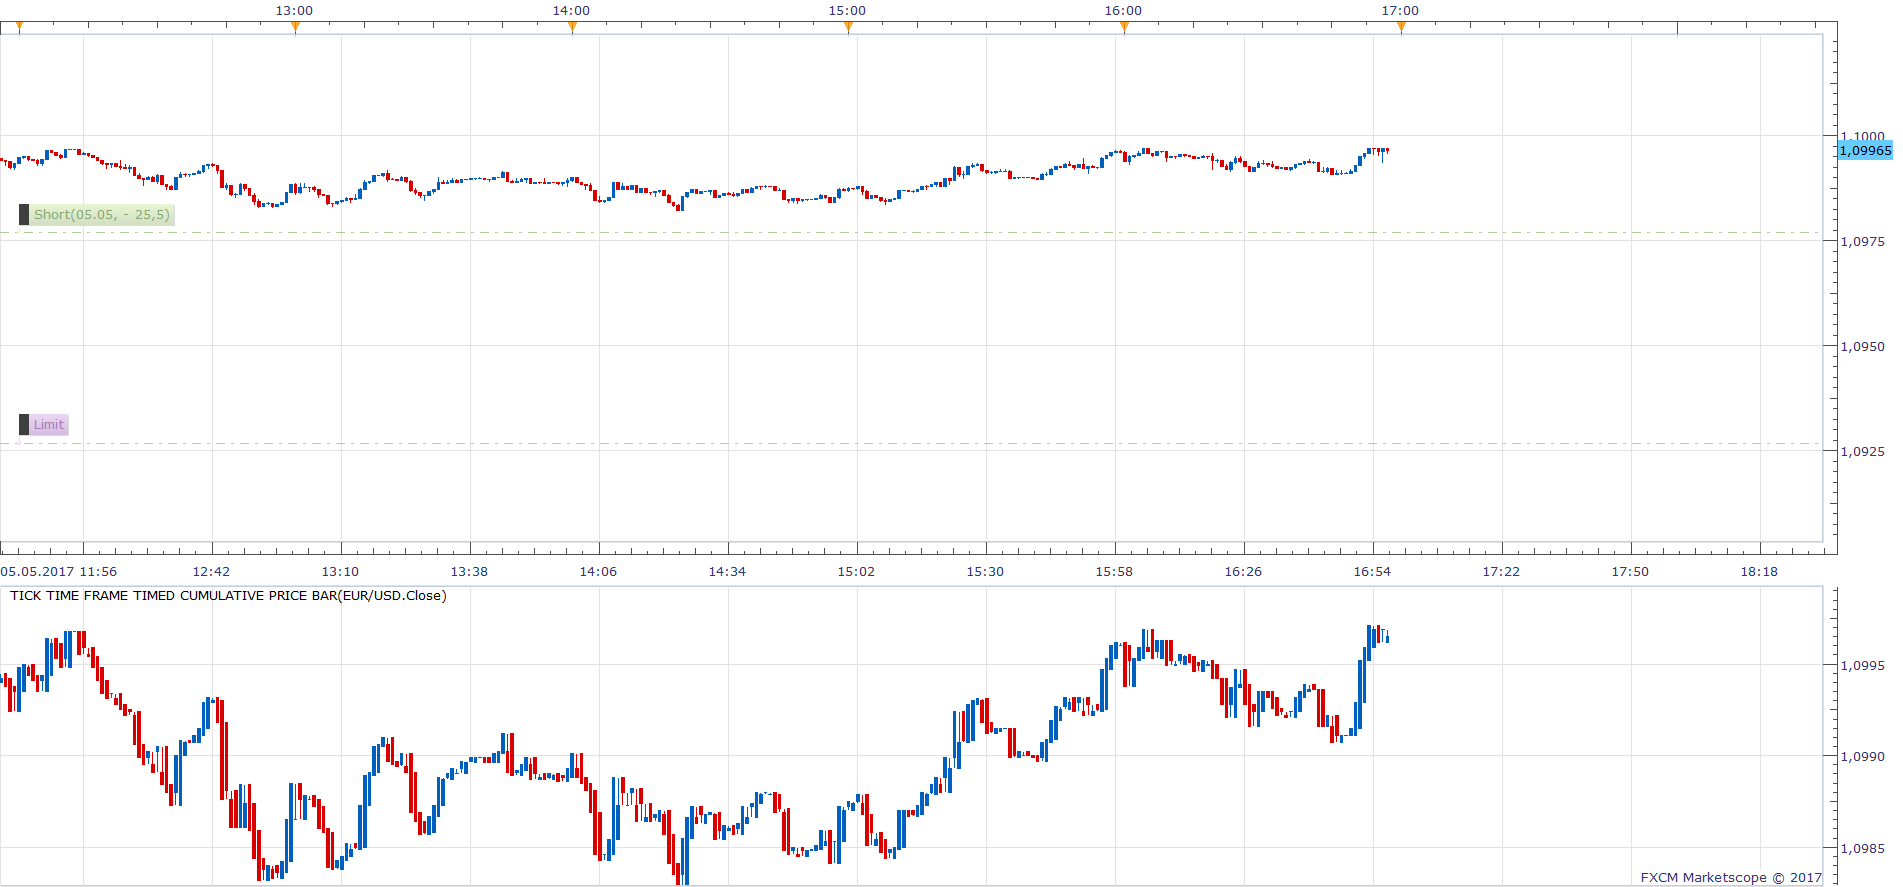
In contrast to the above versions, Tick Time Frame Timed Cumulative Price Bar have candle duration determined in seconds.
Tick Time Frame Timed Cumulative Price Bar.lua
The indicator was revised and updated
Re: Cumulative Price Bar
Apprentice · Sat Feb 18, 2017 5:36 am
Indicator was revised and updated.
Re: Cumulative Price Bar
ekonom29 · Thu Mar 02, 2017 12:23 am
can it have anchor time
example i want to start the calculation at 6 pm on 1minute chart so it use candle 6pm as acnhor point to calcute cumulative price bar,
Re: Cumulative Price Bar
Apprentice · Sun May 07, 2017 6:47 am
Tick Time Frame Timed Cumulative Price Bar.lua added.