fxcodebase-backup
Custom candles
Source: https://fxcodebase.com/code/viewtopic.php?f=17&t=3320
Forum: 17 · Topic 3320 · 14 post(s)
Custom candles
Alexander.Gettinger · Fri Feb 04, 2011 1:28 am
Indicator draw candles with custom timesize. For example, 3000 second candles picture:
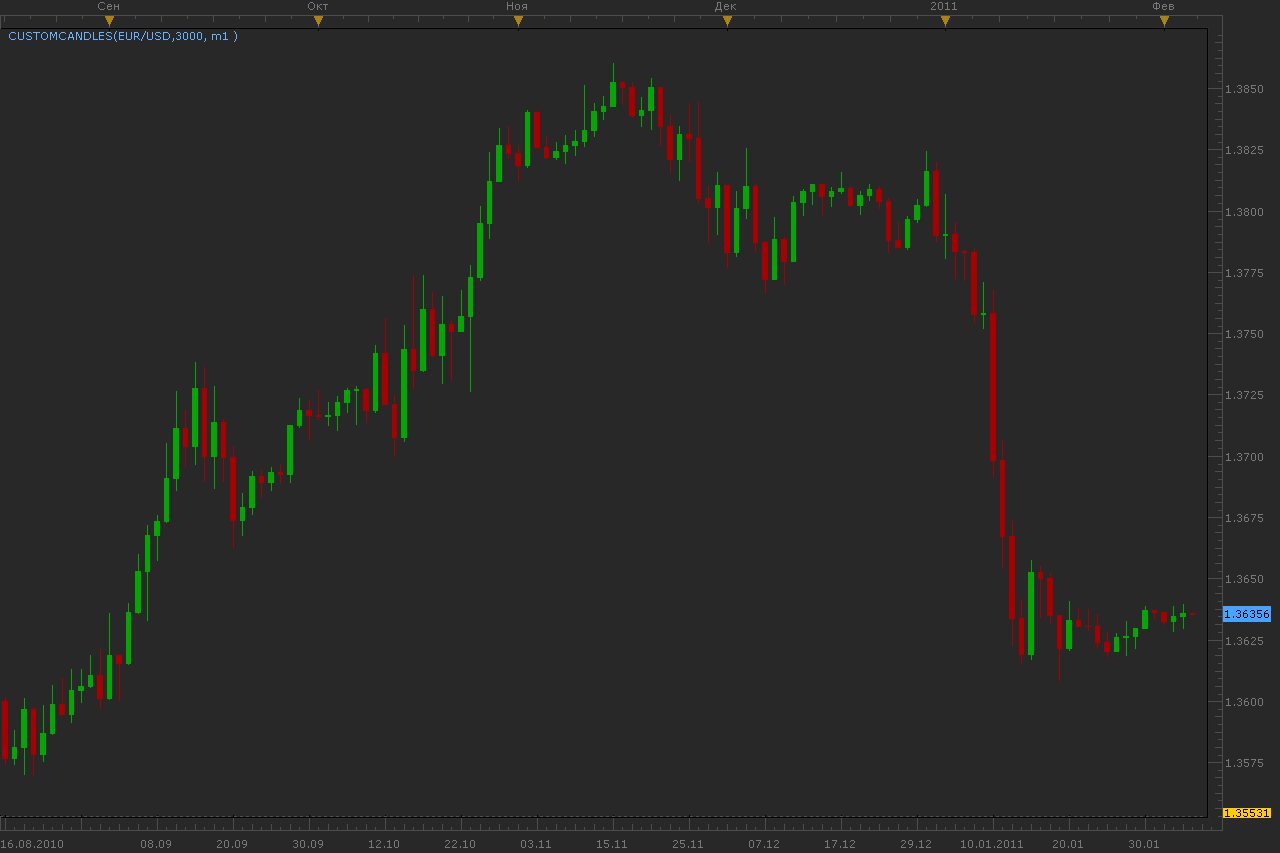
Parameters [Time frame to calculate] and [Max. bars on chart] needs for optimization of the calculations, because when use tick data indicator can be calculated long.
Download:
The indicator was revised and updated
Re: Custom candles
Alexander.Gettinger · Fri Feb 04, 2011 1:30 am
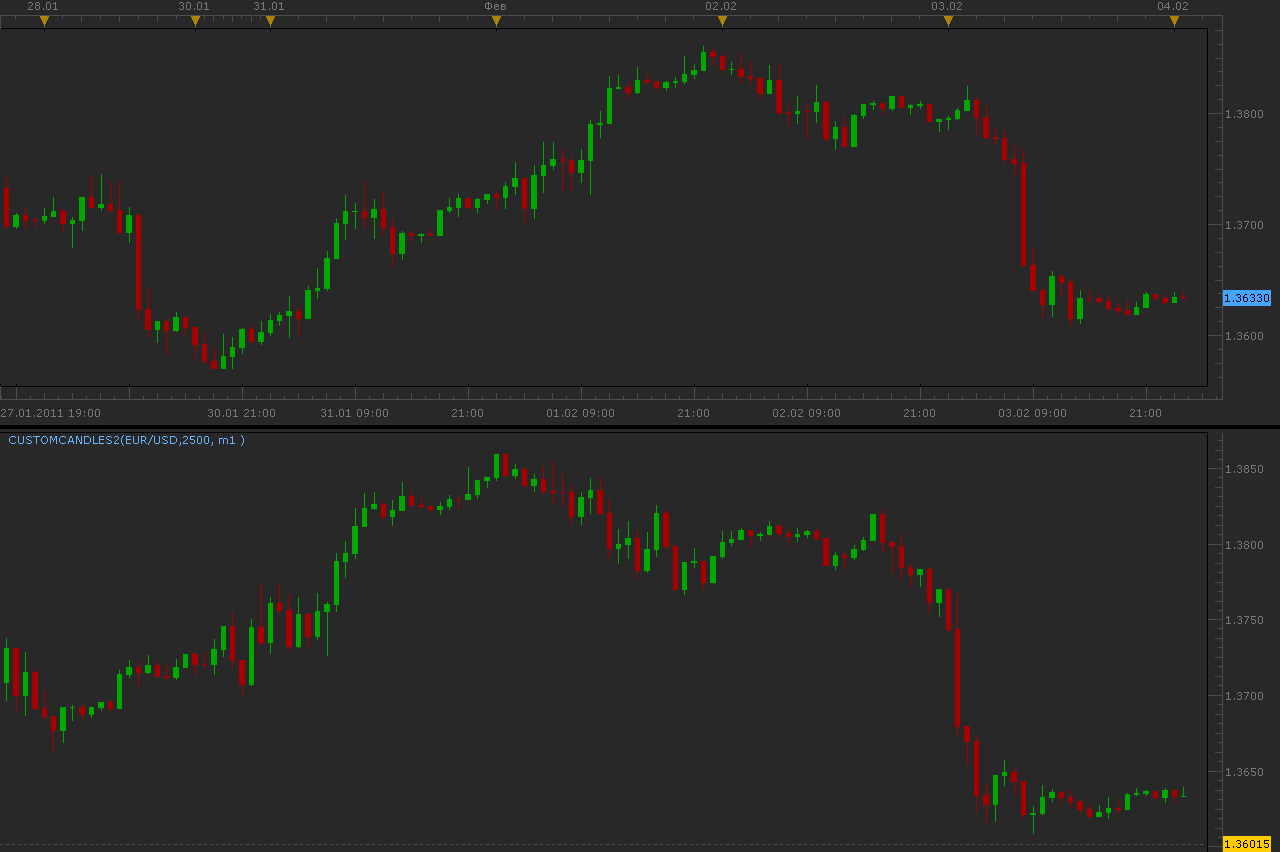
Other version of indicator draw candles in additional chart.
Download:
Re: Custom candles
Forexlooser · Fri Feb 04, 2011 9:43 am
Hello Alex, thank you for this nice Indicator.
Can you create a Multi-Tick Chart ?
Also draw a Candel about 100 or 200 Ticks, not seconds.
Thank you and bye
andy
Re: Custom candles
Alexander.Gettinger · Fri Feb 04, 2011 8:38 pm
Forexlooser wrote: Can you create a Multi-Tick Chart ? andy
I work on this now.
Re: Custom candles
alextrade · Sat Feb 05, 2011 12:49 pm
Hi Alex, i was also wondering if you can create a tick chart and show it counting down on the screen, at present i use 1 minute bar candles for my entries but could really do with a 90 tick chart like you can get from tradestation,many thanks. Alex M
Re: Custom candles
Alexander.Gettinger · Tue Feb 08, 2011 3:00 am
Forexlooser wrote: Can you create a Multi-Tick Chart ? andy
Please see this indicator: viewtopic.php?f=17&t=3347
Re: Custom candles
alextrade · Tue Feb 08, 2011 4:34 am
Hi Alex , this is perfect exactly what i need, do you no if it is possible to create a entry box when you trade from the charts. i trade in multiples of 3 and i scale out at 15pips 30 pips and 45pips for my targets, so instead of having to enter 3 separate enrtys would it be possible to create a pop up box that you enter your order e.g. ENTRY STOP LIMIT 1 130.00 129.80 130.15 2 130.00 129.80 130.30 3 130.00 129.80 130.45 this would just make life easy and quicker when entering orders, not sure if it can be done but thanks anyway Alex M.
Re: Custom candles
Alexander.Gettinger · Wed Feb 09, 2011 3:58 am
Do you can show picture to I understand what do you want?
Re: Custom candles
alextrade · Wed Feb 09, 2011 12:07 pm
If you right click on the charts you go to ORDER ENTRY a box appears i need to modify that box or create a indicator to take 3 orders at 1 time allowing me also to enter a stop loss 3 times and a limit 3 times so that when i make a trade it will take profit at 3 different levels basically the trade will be on auto pilot. i can email you a script for exactly what i want but it is coded for MT4 would this be any help? if so can you provide an email i can send to.. thanks again Alex.
Alex M
Re: Custom candles
030985 · Fri Apr 27, 2012 10:00 am
Hello,
I was trying this indicator but I do not manage to make it work. This is the error I get when trying to launch it : “An error occurred during the calculation of the indicator ‘CUSTOMCANDLES’. The error details: [string “CustomCandles.lua”]:234: [string “CustomCandles.lua”]:130: attempt to index field ‘open’ (a nil value).” I tried with different charts but without success.
May someone know why is that ?
Thank you very much.
Re: Custom candles
TudorJones · Fri Apr 12, 2013 8:36 pm
Helloo mr apparentice
I was hoping if you can make a custome candle that marks when the candle body is close 5% from its high for a bull candle and 5% from its low for a bear candle on a daily and weekly and 4hr chart ?
Thank you in advance You’re a genius
Re: Custom candles
030985 · Wed Oct 15, 2014 9:34 am
030985 wrote: Hello,
I was trying this indicator but I do not manage to make it work. This is the error I get when trying to launch it : “An error occurred during the calculation of the indicator ‘CUSTOMCANDLES’. The error details: [string “CustomCandles.lua”]:234: [string “CustomCandles.lua”]:130: attempt to index field ‘open’ (a nil value).” I tried with different charts but without success.
May someone know why is that ?
Thank you very much. ;)
Hello,
I tried again this indicator, and whatever I try, I cannot get it to work, and have this error. May someone know why it is happening ? Or could someone confirm that the indicator is working correctly on their platform ?
EDIT: if I try for example 120seconds charts on a 1 minute chart, it works. The issue occurs when I try with a number under 60 seconds charts (for example 30 seconds). How to proceed if I want to see 30 seconds chart ?
Thank you very much for your assistance :)
030985
Re: Custom candles
Apprentice · Sat Jul 01, 2017 5:16 am
The indicator was revised and updated.
Re: Custom candles
Apprentice · Mon Jul 17, 2017 4:30 pm
Try this version. viewtopic.php?f=17&t=64929