fxcodebase-backup
Data Overlay
Source: https://fxcodebase.com/code/viewtopic.php?f=17&t=7183
Forum: 17 · Topic 7183 · 8 post(s)
Data Overlay
Apprentice · Tue Oct 11, 2011 8:39 am
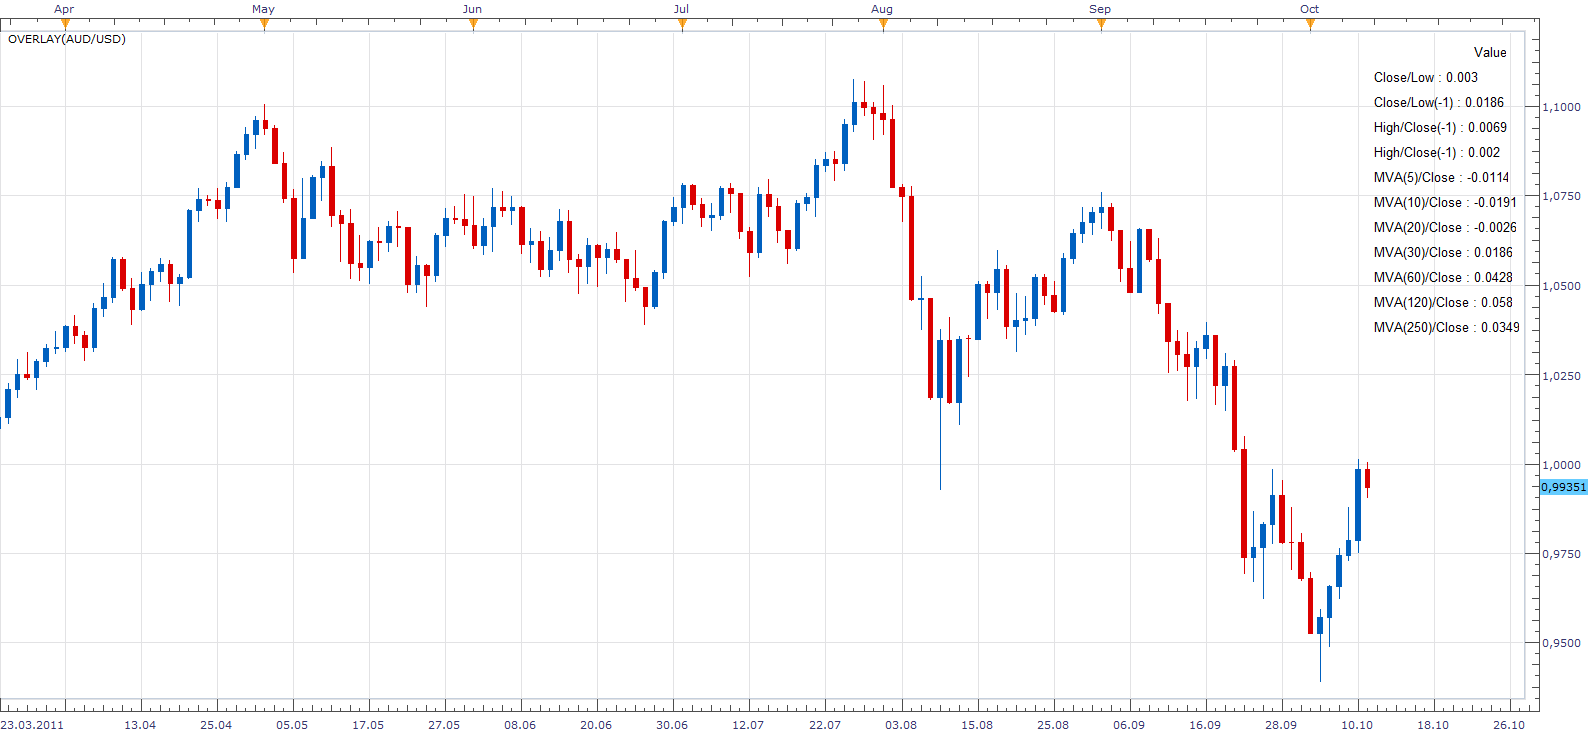
This simple indicator displays the following information. “Close/Low”, “Close/Low(-1)”, “High/Close(-1), “High/Close(-1)” and “MVA( PERIOD”)/Close For this Periods 5,10, 20, 30, 60, 120, 250
The data can be displayed in Pips.
The indicator was revised and updated
MT4/MQ4 version. viewtopic.php?f=38&t=65975
Re: Data Overlay
kingsee · Tue Oct 11, 2011 12:30 pm
Thank you very much!!!
but how can i display the information on the top/left of screen?so ,i can study the chart clearly.
Re: Data Overlay
Apprentice · Tue Oct 11, 2011 4:28 pm
This is the version that presents data in two lines at the top of the chart.
Re: Data Overlay
kingsee · Wed Oct 12, 2011 1:02 am
Thank you very much.The data at the top of the chart is great!!! But i think presenting data in one lines at the top of the chart is a better way.we can using vlaues with different colors insteading different indicators’ name. for example ,from left to right,the first red value means mva(250)/close; the second blue value means mva(120)/close…..according to the color,i can find out what i want quickly. I like the following setting :
colors of values means indicator red mva(250)/close blue mva(120)/close aqua mva(60)/close silver mva(30)/close magenta mva(20)/close green mva(10)/close yellow mva(5)/close green h(-1)/c (The h(-1)/c posted may be wrong .it ought to be:yesterday’s high-todays’s close) green h/c red c/l(-1) red c/l
do me a favor ,please .thanks a lot!
Re: Data Overlay
jsi@jp · Wed Oct 12, 2011 6:18 am
Thank you very much for this indicator. This indicator seems to be useful for risk management. Can you add Amount.
<>Example<> ——————————————————————————————————————- Amount = The usable margin * 0.02 / ((source.close[period] - source.high[period-1]) + Spread) * (1 / Pip Cost)
Amount = The usable margin * 0.02 / ((source.close[period] - source.low[period-1]) + Spread) * (1 / Pip Cost)
0.02 = Risk management % (It can input arbitrarily.)
Thank you for your time and consideration.
jsi@jp
Re: Data Overlay
Apprentice · Wed Oct 12, 2011 5:08 pm
Your request is added to the developmental cue.
Re: Data Overlay
kingsee · Wed Oct 12, 2011 8:25 pm
thank you
Re: Data Overlay
Apprentice · Fri Mar 17, 2017 6:53 am
Indicator was revised and updated.