fxcodebase-backup
DEMA_RSI
Source: https://fxcodebase.com/code/viewtopic.php?f=17&t=63359
Forum: 17 · Topic 63359 · 4 post(s)
DEMA_RSI
Apprentice · Sun Apr 10, 2016 9:31 am
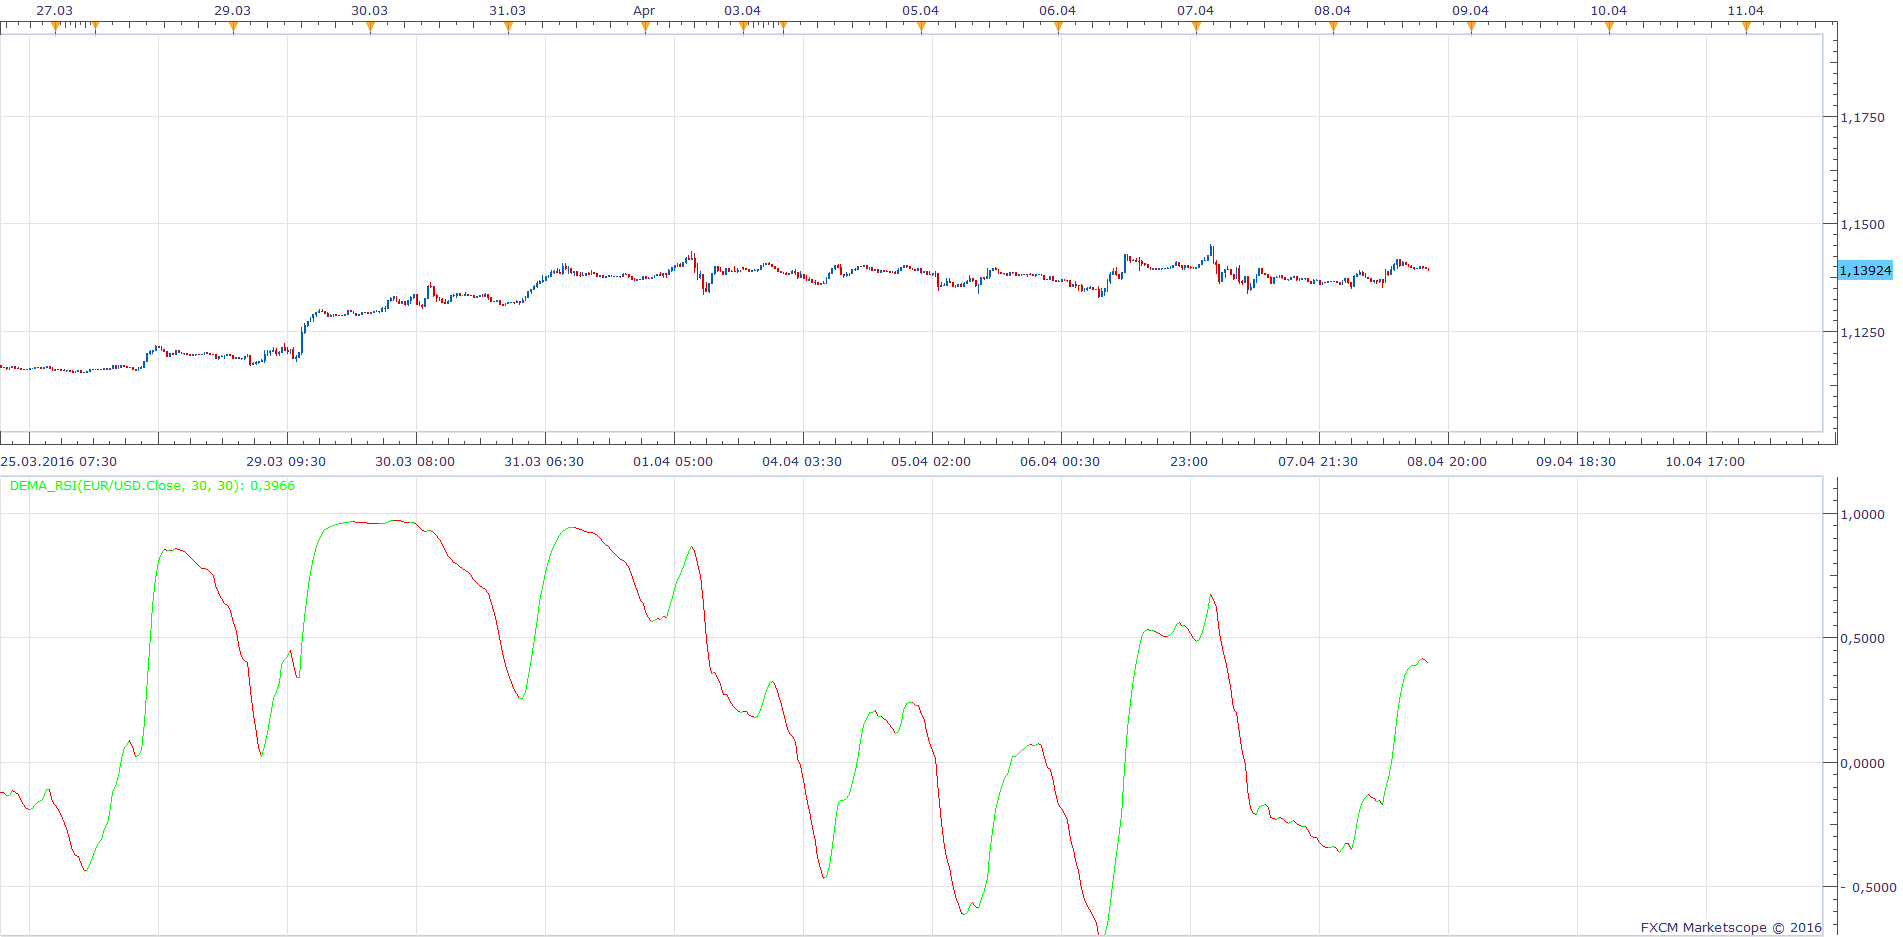
Based on request. viewtopic.php?f=27&t=63327
Re: DEMA_RSI
Steve0001 · Mon Apr 11, 2016 1:29 pm
This interesting, but also a little confusing. I understand this is some kind of Double Exponential Moving Average (DEMA). It is confusing however because I would have expected the DEMA to be plotted on the chart with price, not plotted as an oscillator in a separate area. Also, some description of how to use it would be helpful (like maybe some suggested “rules” for applying this to trading). Thanks.
Re: DEMA_RSI
Steve0001 · Mon Apr 11, 2016 2:40 pm
Oops! Only after posting my comment did I realize that it says DEMA_RSI, not DEMA. My bad! So now it is clear that the indicator is DEMA applied to RSI (less explanation was OK after all).
Re: DEMA_RSI
Apprentice · Fri Jul 13, 2018 4:20 am
The indicator was revised and updated.