fxcodebase-backup
Deviation from MA
Source: https://fxcodebase.com/code/viewtopic.php?f=17&t=3293
Forum: 17 · Topic 3293 · 5 post(s)
Deviation from MA
Alexander.Gettinger · Mon Jan 31, 2011 2:10 am
Indicator show deviation between MA and price. For find the maximums used [Frame] bars (as for fractals). Arrow are shown maximums of the deviation of the price from MA.
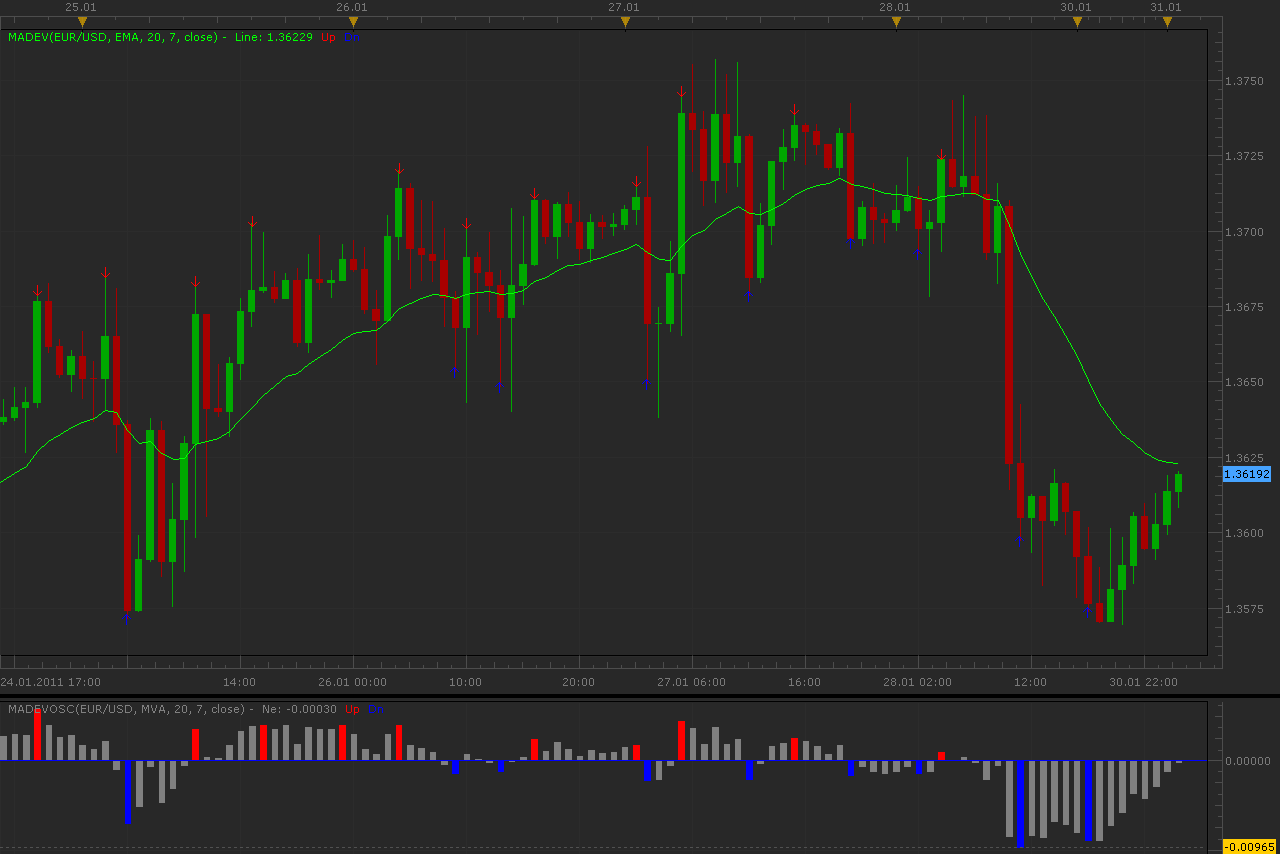
Download:
Also, there is a oscillator version. Download:
For this indicators must be installed AVERAGES indicator: viewtopic.php?f=17&t=2430
The indicator was revised and updated
Re: Deviation from MA
Alexander.Gettinger · Mon Jan 31, 2011 10:19 pm
Strategy on this indicator: viewtopic.php?f=31&t=3297
Re: Deviation from MA
craige · Mon Jan 31, 2011 10:58 pm
Hey Guys
thanks for the great effort
I observed this indicator for 5 hours consecutively, finding it is a lagging indi.
during the process of the observation, after the fifth candle closed, there is a arrow emerged on the second candle.
do I miss something, or I got the wrong parameter setting?
thank you
Re: Deviation from MA
RJH501 · Sun Sep 18, 2011 3:57 pm
Hello Alexander,
When you get time could you develop a signal that occurs whenever a buy or sell histogram marker occurs?
Thank you,
Richard
Re: Deviation from MA
Apprentice · Thu Mar 16, 2017 2:15 pm
Indicator was revised and updated.