fxcodebase-backup
Gann HiLo Activator
Source: https://fxcodebase.com/code/viewtopic.php?f=17&t=227
Forum: 17 · Topic 227 · 18 post(s)
Gann HiLo Activator
TonyMod · Wed Jan 06, 2010 1:41 pm
Hello,
Here is a indicator called “Gann Hi-Lo Activator”.
Description on how to use this indicator you can find here: http://forex-strategies-revealed.com/mt4/gann-hilo-activator
Screenshot of Gann Hi-Lo Activator in MarketScope:
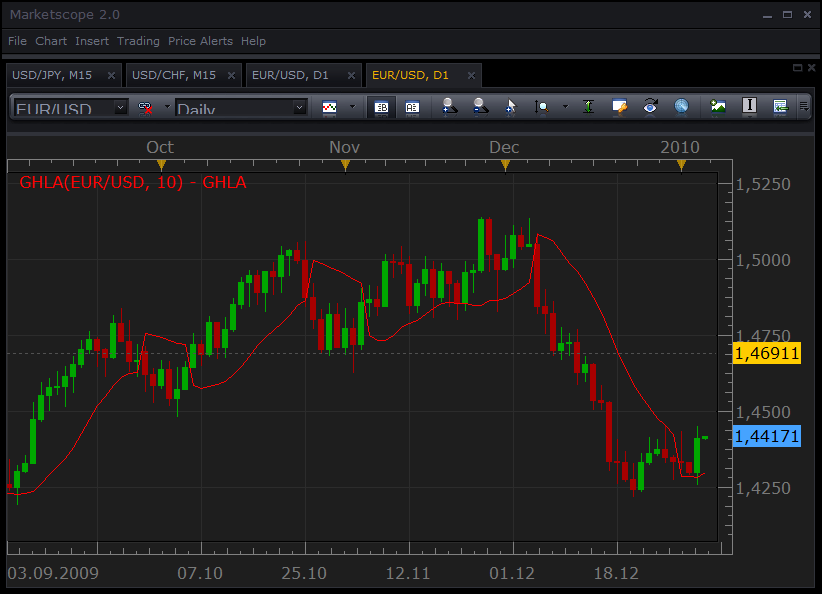
Screenshot of indicator in MarketScope charts.
Download: MVA (Original) Version
The version that has a selection of several types of moving averages.
Averages.lua viewtopic.php?f=17&t=2430
MT4/MQ4 version. viewtopic.php?f=38&t=65122
Re: Gann HiLo Activator
Apprentice · Sat Nov 06, 2010 8:45 am
Style Update.
Re: Gann HiLo Activator
deltayod · Wed Dec 15, 2010 11:26 am
Could you please code this indi in MTF? I realize that recently the MTF Heatmap was published but it would be nice to see MTF GHLA on the price chart to gauge distance from MTF Support/Resistance levels. Foe example, on the M5 chart, I use H1 & H4 GHLA and they clearly show how far before breakout or reversal. Thanks.
Re: Gann HiLo Activator
Apprentice · Wed Dec 15, 2010 12:40 pm
Added to developmental cue.
Re: Gann HiLo Activator
Apprentice · Fri Dec 17, 2010 4:35 am
Bigger timeframe Gann High Low Activator can be found here. viewtopic.php?f=17&t=2978
Re: Gann HiLo Activator
HNAES44 · Mon Feb 28, 2011 4:44 pm
Hello,
I’d like to backtest on FXCM Marketsope 2.0 a strategy only based on Gann HiLo indicator. Could you tell me if this strategy does already exist and where can I found it? If not, could you please develop it, i would really be intersted in trying it as soon as possible ?
Thanks a lot
Sincerly
hnaes44
Re: Gann HiLo Activator
Apprentice · Tue Mar 01, 2011 6:02 am
Requested can be found here. viewtopic.php?f=31&t=3562
Re: Gann HiLo Activator
Apprentice · Thu Nov 17, 2011 3:34 am
Version that has a selection of several types of moving averages added.
Re: Gann HiLo Activator
turkuaz · Fri Nov 18, 2011 1:38 am
Dear Apprentice
Can we use the strategy with hillo Gan super trend indicator. Take for example the case of super-trend sales strategy or open position. Or position of the spool. Super-position of the turn also supports the trend.
Can we edit such a strategy.
respects
Re: Gann HiLo Activator
Apprentice · Fri Nov 18, 2011 4:47 am
Unfortunately I’m not sure I understand your request. Can you define the conditions.
Like this. Buy If GHLA CrossUnder ….. and GHLA <…. or ….
Sell …
Re: Gann HiLo Activator
turkuaz · Fri Nov 18, 2011 9:49 am
Dear Apprentice
Has not looked back my theory correct. For this reason, do not take my request into consideration. respects
Re: Gann HiLo Activator
Apprentice · Sun Mar 08, 2015 3:21 am
Updated.
Re: Gann HiLo Activator
wakitrader · Fri Feb 05, 2016 5:39 am
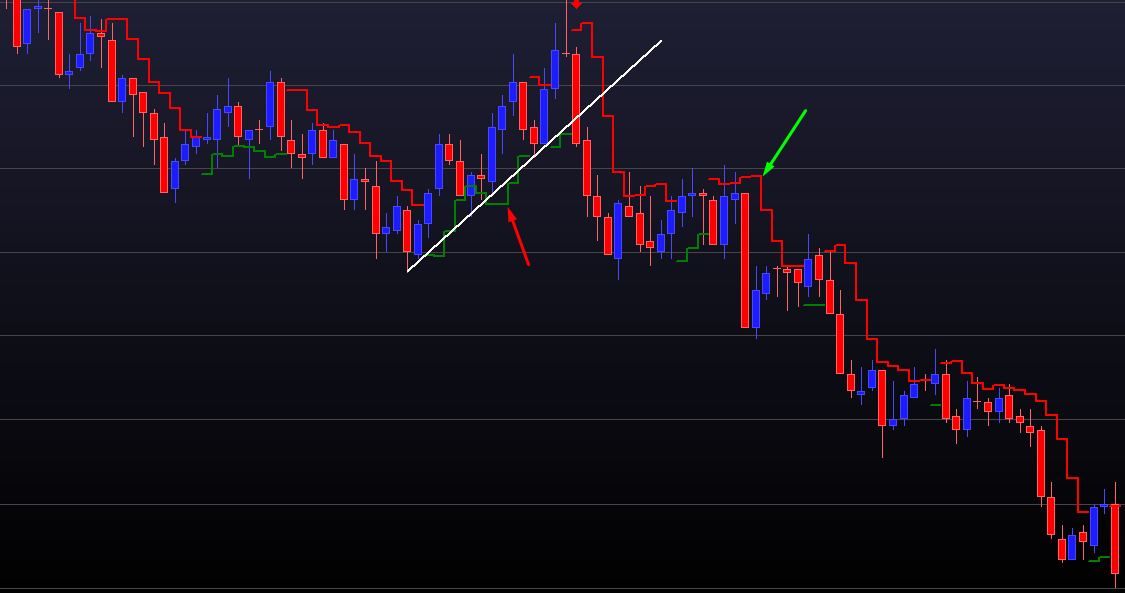
hello I would like to know if you have this hilo?
Re: Gann HiLo Activator
Apprentice · Fri Feb 05, 2016 7:45 am
You will have to provide more information. Indicator name, formula, description or better yet, indicator code.
Post your request here. viewforum.php?f=27
Re: Gann HiLo Activator
Apprentice · Sat Feb 06, 2016 11:51 am
Try GHLA Touchline.lua
Re: Gann HiLo Activator
Apprentice · Tue Oct 23, 2018 6:34 am
The indicator was revised and updated.
Re: Gann HiLo Activator
Apprentice · Fri Nov 26, 2021 7:38 am
GHLA Averages.lua added.
Re: Gann HiLo Activator
fortcentral · Sun Feb 01, 2026 12:04 am
Hi, Can the plot for the Gann HiLo Activator be slightly modified please, to reflect the original author’s (Robert Krausz) directions?
The GHLA.lua indicator posted here has the correct calculation/performance. However, Krausz’s plot of the “calculated point” was a horizontal line spanning the half-way distance between bars, from half of the gap before a bar, to half-gap after a bar, instead of plotting the “calculated point” on the bar itself. This gave a clearer visual separation with price movement on a live bar, as he used this indicator both for “stop loss” and as a “trend” indicator in live trading in his time (~1980s).
The switch from using bar “low (or high)” prices for calculation of the moving-average line, to using bar “high (or low)” prices for the line, only happened when the price closed “below (or above)” the moving average “calculated point/line”.
In Krausz’s original HiLo Activator, if price penetrated the “Activator” line by a “user determined” amount, for example 5 pips (or 2 ticks in his case), then a second plot of the calculation using the “switch” in high (or low) value, would appear on the same bar; but this second “Activator” plot line would disappear, if price did not end up closing above (or below) the “Activator line”.
Some photos are attached from Krausz’s work for greater clarity.
Thank you.