fxcodebase-backup
High-Low Pip Range
Source: https://fxcodebase.com/code/viewtopic.php?f=17&t=61733
Forum: 17 · Topic 61733 · 7 post(s)
High-Low Pip Range
Apprentice · Mon Jan 19, 2015 5:09 am
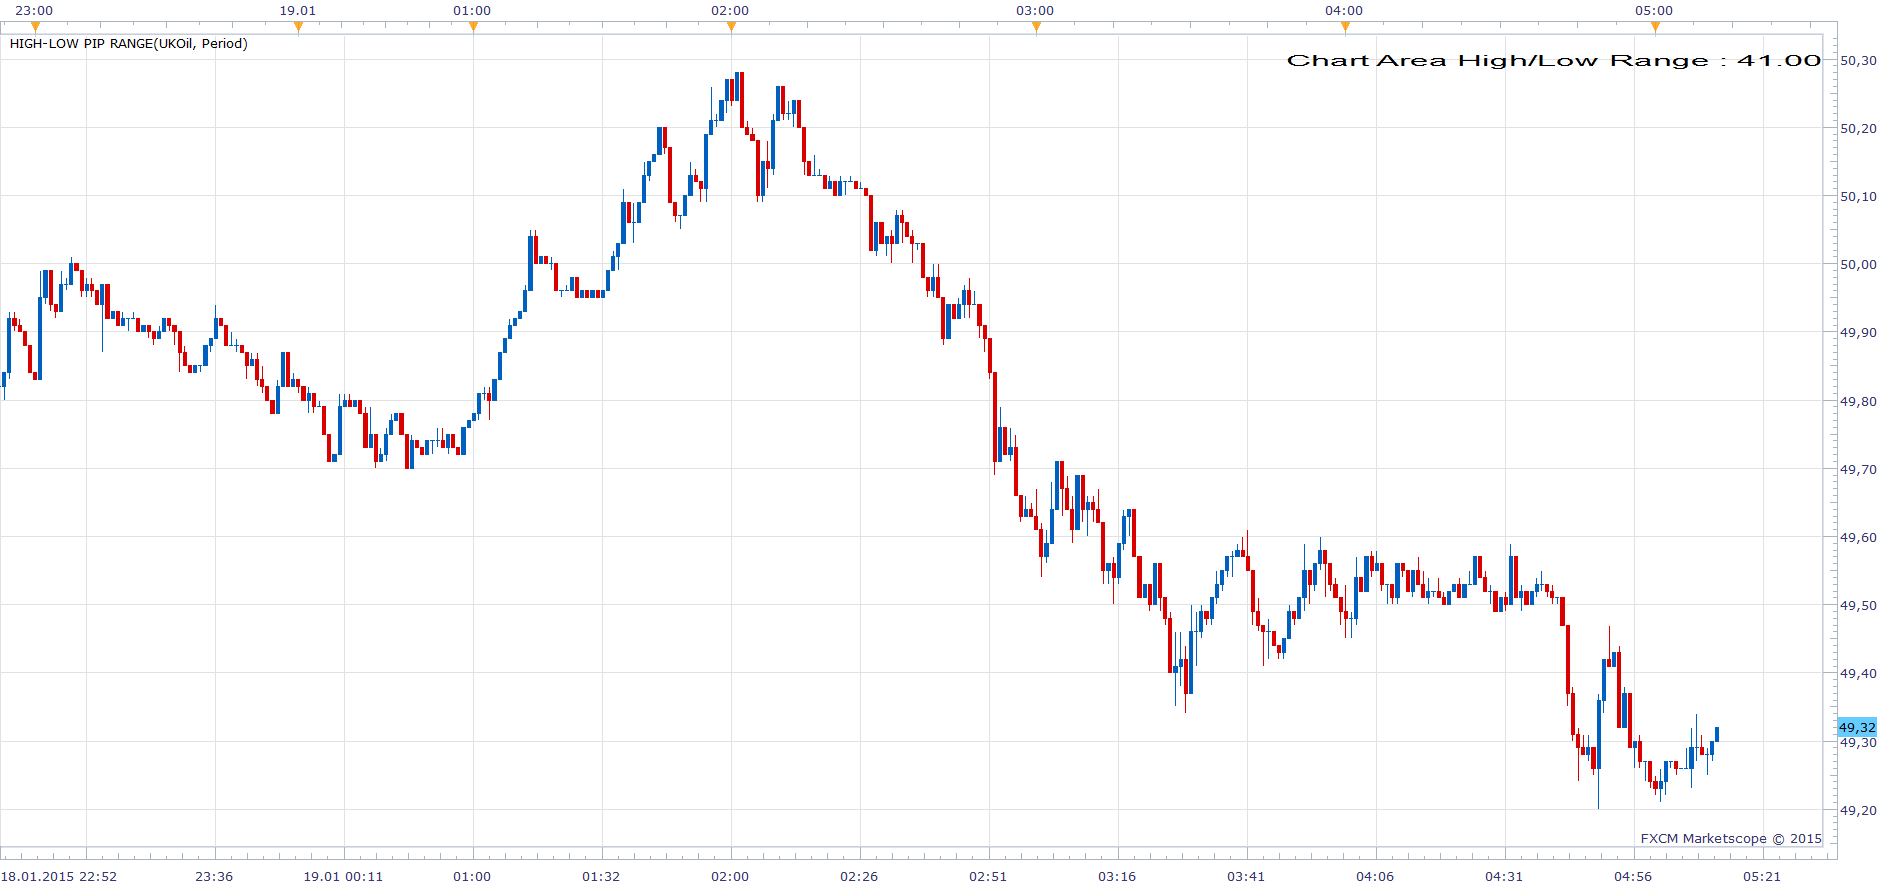
Based on the request. viewtopic.php?f=27&t=61725 Show the High-Low range in pips of the currently chart’s visible area
High-Low Pip Range Tick Version.lua
The indicator was revised and updated
Re: High-Low Pip Range
SuperTrader · Thu Oct 29, 2015 1:42 am
Hi Apprentice, this is a really helpful indicator, so traders can see at a glance a displayed chart’s total high-low movement in pips (without having to use the ruler-tool all the time to measure pips, as many times it’s hard to judge the real-size of movements by simply looking at a chart). Your indicator works fine as it is now, but could you please (whenever you have time) modify its code so it can also be applied on tick-charts? (at least for the visible chart’s pips, the first of your three options in the user-settings). Thank you very much in advance!
Re: High-Low Pip Range
Apprentice · Thu Oct 29, 2015 3:56 am
Tick Version added.
Re: High-Low Pip Range
SuperTrader · Thu Nov 05, 2015 1:51 am
Hi Apprentice, your new Tick Version works fine on other timeframes, but it still cannot be applied on tick-charts (as it’s not offered as an available indicator in there). Please take a look when you have time, thank you!
Re: High-Low Pip Range
Apprentice · Fri Nov 06, 2015 4:52 am
Try it now.
Re: High-Low Pip Range
SuperTrader · Fri Nov 06, 2015 5:10 am
yep, it can also be applied on tick-charts now (and still works perfectly of course). Thank you very much, amazing work once again!
Re: High-Low Pip Range
Apprentice · Sat Aug 05, 2017 4:29 am
The indicator was revised and updated.