fxcodebase-backup
Hurst Exponent
Source: https://fxcodebase.com/code/viewtopic.php?f=17&t=75433
Forum: 17 · Topic 75433 · 4 post(s)
Hurst Exponent
Apprentice · Wed Dec 18, 2024 5:57 am
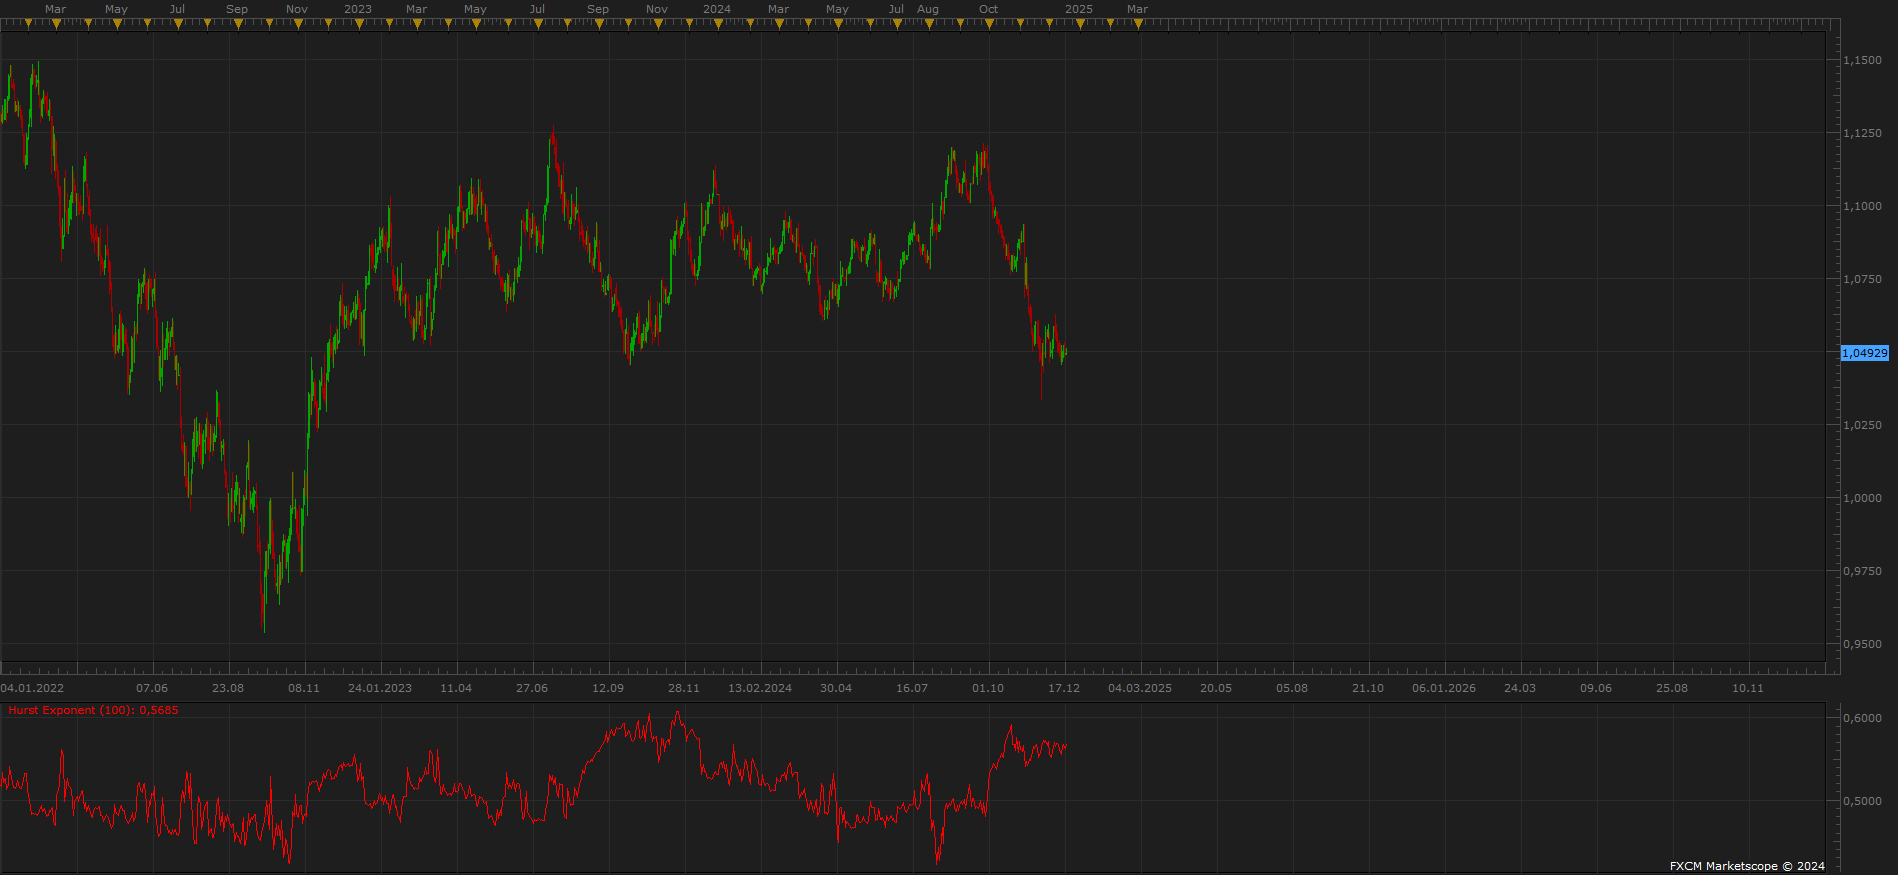
Overview The Hurst Exponent is a statistical indicator used to measure the long-term memory of a time series. It is widely utilized in finance to understand market dynamics and price behavior. By analyzing the Hurst Exponent, traders can identify if a market is trending, mean-reverting, or behaving randomly.
What does the Hurst Exponent tell us?
•H > 0.5: Indicates a trending market. The higher the value, the stronger the trend. •H < 0.5: Implies mean-reverting behavior, suggesting prices are more likely to revert to a mean over time.
- H = 0.5: Implies a random walk, often seen as market efficiency with no predictability.
Key Features of the Indicator
•Calculation Period: Users can customize the number of bars used in the Hurst Exponent calculation. This period determines the window size for analysis. •Customizable Style: Traders can adjust the color, width, and line style of the Hurst Exponent displayed on the chart.
- Optional Smoothing: To reduce noise, smoothing can be applied to the Hurst Exponent values using a moving average with a user-defined smoothing period.
Input Parameters
•Period: The number of bars used in the calculation of the Hurst Exponent. •Line Color: Customize the line color for better visibility. •Line Width: Set the thickness of the line (1 to 5) for easier visualization. •Line Style: Choose between solid, dashed, or dotted lines. •Use Smoothing: Enable or disable optional smoothing to reduce noise in the indicator. •Smoothing Period: If smoothing is enabled, this parameter defines the number of periods used for the moving average.
How does it work?
•Data Collection: The indicator collects the price data for the specified period. •Log Returns Calculation: It calculates the logarithmic returns between successive prices. •Rescaled Range (R/S) Calculation: This measures the dispersion in the price data relative to its standard deviation. •Hurst Exponent Calculation: The slope of the log(R/S) vs. log(N) is used to calculate the Hurst Exponent.
- Optional Smoothing: If enabled, a moving average is applied to the Hurst Exponent values to reduce noise.
How to Use It in Trading
•Trend-Following Strategy: If H > 0.5, it indicates a trending market. Traders might look to follow the trend using momentum-based strategies. •Mean Reversion Strategy: If H < 0.5, mean-reverting behavior is expected. In this scenario, traders might use oscillators or contrarian strategies to trade reversions to the mean.
- Random Market Detection: If H = 0.5, the market is in a random walk state, where no clear trend or mean reversion is present. Traders might avoid taking positions or use different market analysis techniques.
Benefits of the Hurst Exponent
•Predict Market Behavior: Helps predict if the market will trend, revert to a mean, or behave randomly. •Customizable Visualization: Traders can customize the visual appearance of the Hurst Exponent to suit their preferences.
- Smoothing for Clarity: Optional smoothing makes it easier to detect trends and market regimes.
Conclusion The Hurst Exponent is a versatile and insightful tool for market analysis. Its ability to distinguish between trending, mean-reverting, and random behavior offers traders a powerful edge in market prediction. The added customization and smoothing options make it an even more user-friendly and valuable indicator for all types of traders. By integrating this indicator into your trading strategy, you can make more informed decisions and better understand the dynamics of the market.
Re: Hurst Exponent
jaguar1637 · Wed Jan 01, 2025 9:28 am
well, nothing new under the sun
it seems to be like those following indicators :
- iVAR
- FGDI
I think FGDI is better
Re: Hurst Exponent
helendam · Mon Jan 06, 2025 9:50 pm
jaguar1637 wrote: well, nothing new under the sun
it seems to be like those following indicators :
- iVAR
- FGDI
I think FGDI is better
I think so
Re: Hurst Exponent
jeffreestar · Mon Jun 02, 2025 2:49 am
great