fxcodebase-backup
Ichimoku Period Extreme Levels
Source: https://fxcodebase.com/code/viewtopic.php?f=17&t=23584
Forum: 17 · Topic 23584 · 14 post(s)
Ichimoku Period Extreme Levels
Apprentice · Wed Sep 19, 2012 5:32 am
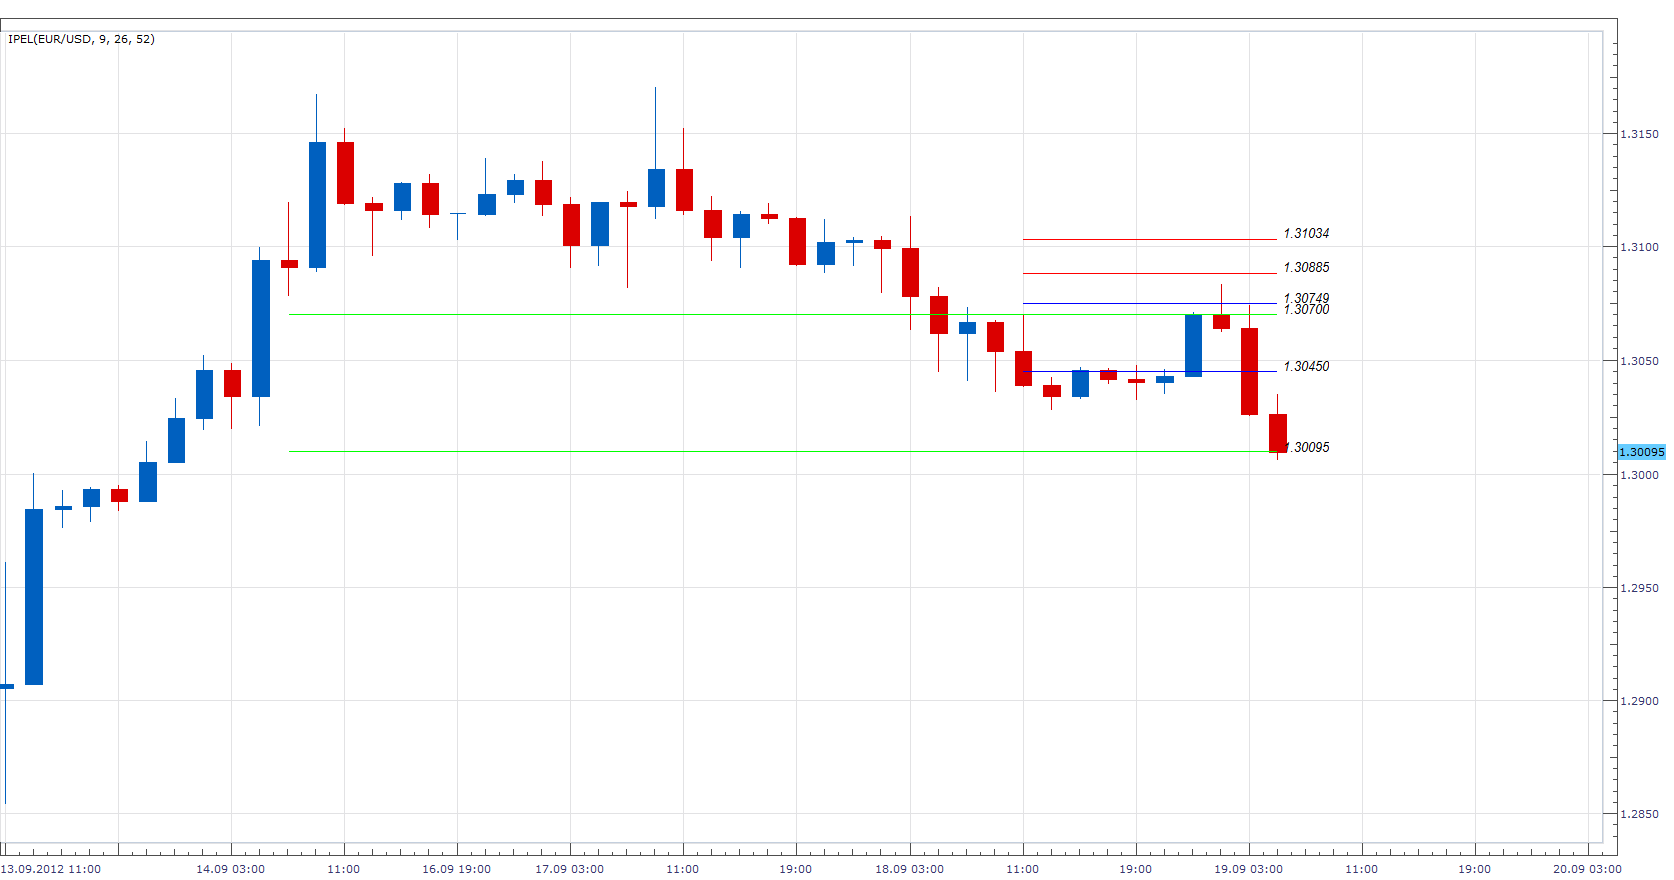
The indicator will draw a line on min and max value of particular ICH component for selected period.
The indicator was revised and updated
Re: Ichimoku Period Extreme Levels
Apprentice · Wed Sep 19, 2012 2:19 pm
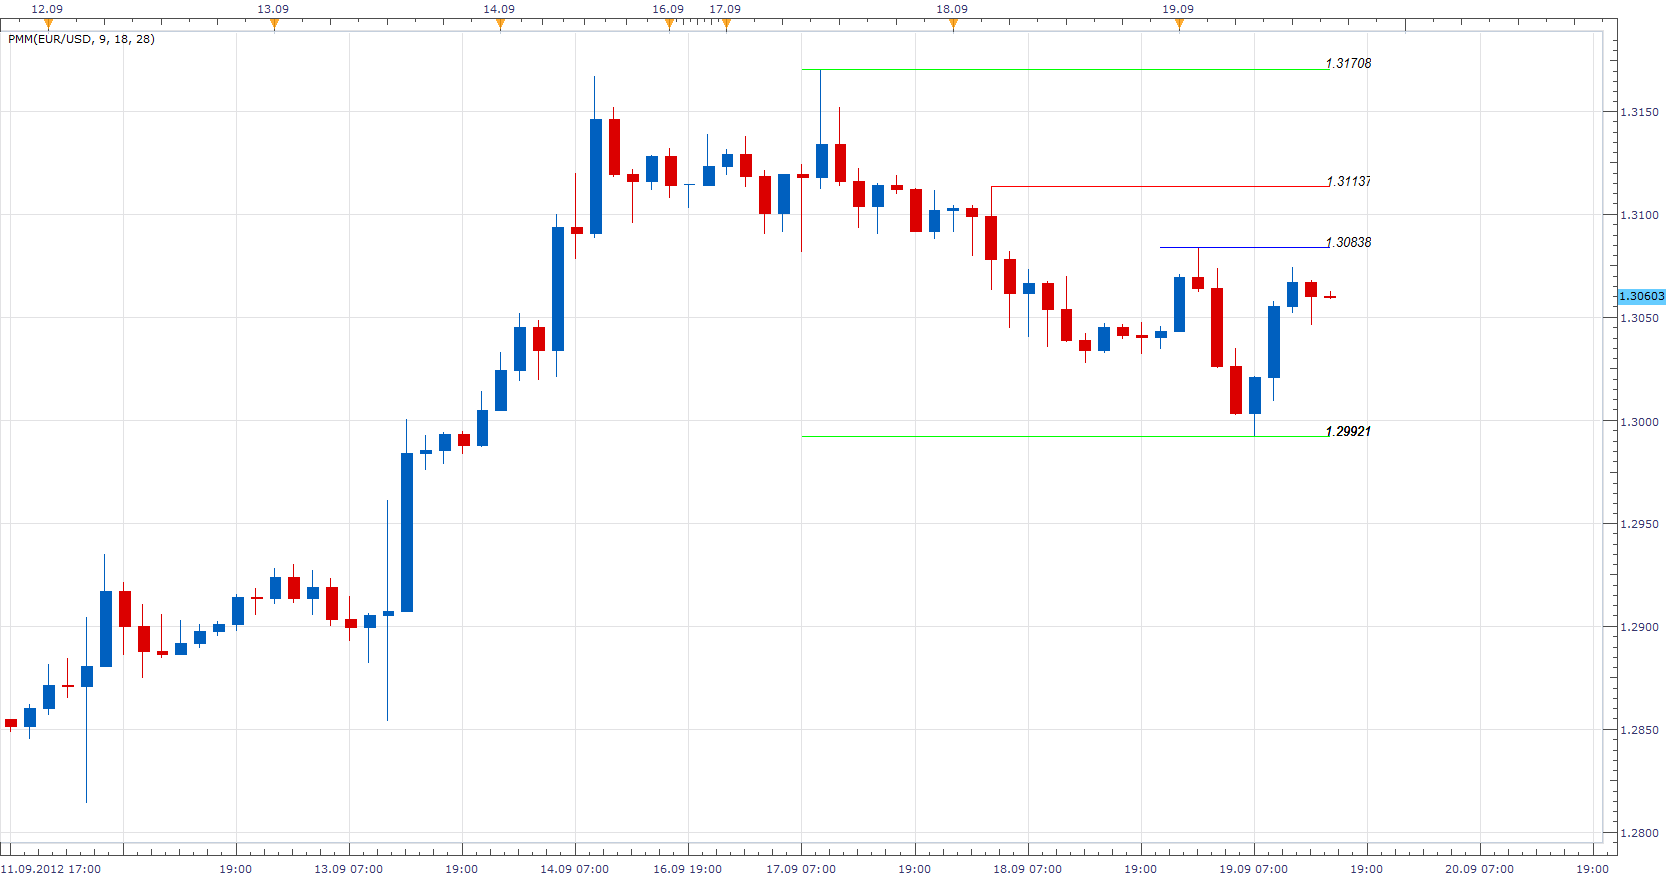
As requested i made Simple spinoff, draws the line at the min / max values achieved by Price during selected period.
Re: Ichimoku Period Extreme Levels
nazaar · Wed Sep 19, 2012 5:51 pm
This is another excellent tool!
Could you add an option to display the pip value between the min max values? Please see attached
Thanks.
Re: Ichimoku Period Extreme Levels
Apprentice · Thu Sep 20, 2012 12:42 am
Pip difference added to PMM.
Re: Ichimoku Period Extreme Levels
nazaar · Thu Sep 20, 2012 6:56 am
Apprentice wrote: Pip difference added to PMM.
Dear Apprentice,
Thanks kindly for adding the pip difference, can you make it a user option to display the price and pip difference?
Thanks.
Re: Ichimoku Period Extreme Levels
nazaar · Tue Oct 09, 2012 2:05 pm
Apprentice wrote: Pip difference added to PMM.
Hello,
Would you be interested in adding to this brilliant tool?
Could you please add the option to identify the most recent tenkan kijun crosses to this tool? Either place a marker or arrow or a symbol at the most recent 3 tenkan / kijun crosses.
Please see attachement.
Thanks very kindly.
Re: Ichimoku Period Extreme Levels
nazaar · Mon Oct 15, 2012 10:53 pm
Apprentice wrote:
The attachment PMM.png is no longer available
As requested i made Simple spinoff, draws the line at the min / max values achieved by Price during selected period.
The attachment PMM.png is no longer available
Hello,
could you please add a 4th line? I tried doing it but I am missing something as it is reading my 3rd and 4th option as the same thing. See attached.
Thanks.
Re: Ichimoku Period Extreme Levels
Apprentice · Tue Oct 16, 2012 6:48 am
Your request has been added to the development list.
Re: Ichimoku Period Extreme Levels
Apprentice · Tue Oct 16, 2012 12:37 pm
The fourth and fifth lines added. Use Zero Period, if you want to delete a line.
Re: Ichimoku Period Extreme Levels
nazaar · Wed Oct 17, 2012 3:39 pm
Hello Apprentice, how are you?
Would you be interested in adding to this tool? The attached indicator draws 3 sets of horizontal lines, used to identify the 9, 26 and 52 periods HH/LL points.
Would you please add an option to display Fib level values between the the HH and LL for a chosen period. The tool would have an option automatically draw and display Fib level between a chosen period, for example fib level between the 26 period HH and LL.
Where to place the fib point A and B would depend on the direction price is moving and ideally it is chosen by the user, is this possible?
Output: Ideally, user would choose to display the fib level and whether to display fib % or fib level prices or both and placed 1 bar ahead of the live bar. Please see attached chart as an example.
I thank you kindly in advance for any consideration.
Re: Ichimoku Period Extreme Levels
Apprentice · Fri Nov 23, 2012 6:58 am
Major PMM Update.
Fib Levels Added. Code is Optimized. Presentation improvement.
Re: Ichimoku Period Extreme Levels
Apprentice · Tue May 02, 2017 12:17 pm
Indicator was revised and updated.
Re: Ichimoku Period Extreme Levels
rosaleen2300 · Tue Dec 14, 2021 1:17 pm
Please convert this “” HH and LL.LUA “” to MQ4 .
Re: Ichimoku Period Extreme Levels
Apprentice · Thu Dec 16, 2021 2:52 pm
Your request is added to the development list. Development reference 1022.