fxcodebase-backup
Inverse Fisher Transform Stochastic Oscillator
Source: https://fxcodebase.com/code/viewtopic.php?f=17&t=26223
Forum: 17 · Topic 26223 · 6 post(s)
Inverse Fisher Transform Stochastic Oscillator
Apprentice · Sun Nov 18, 2012 7:15 am
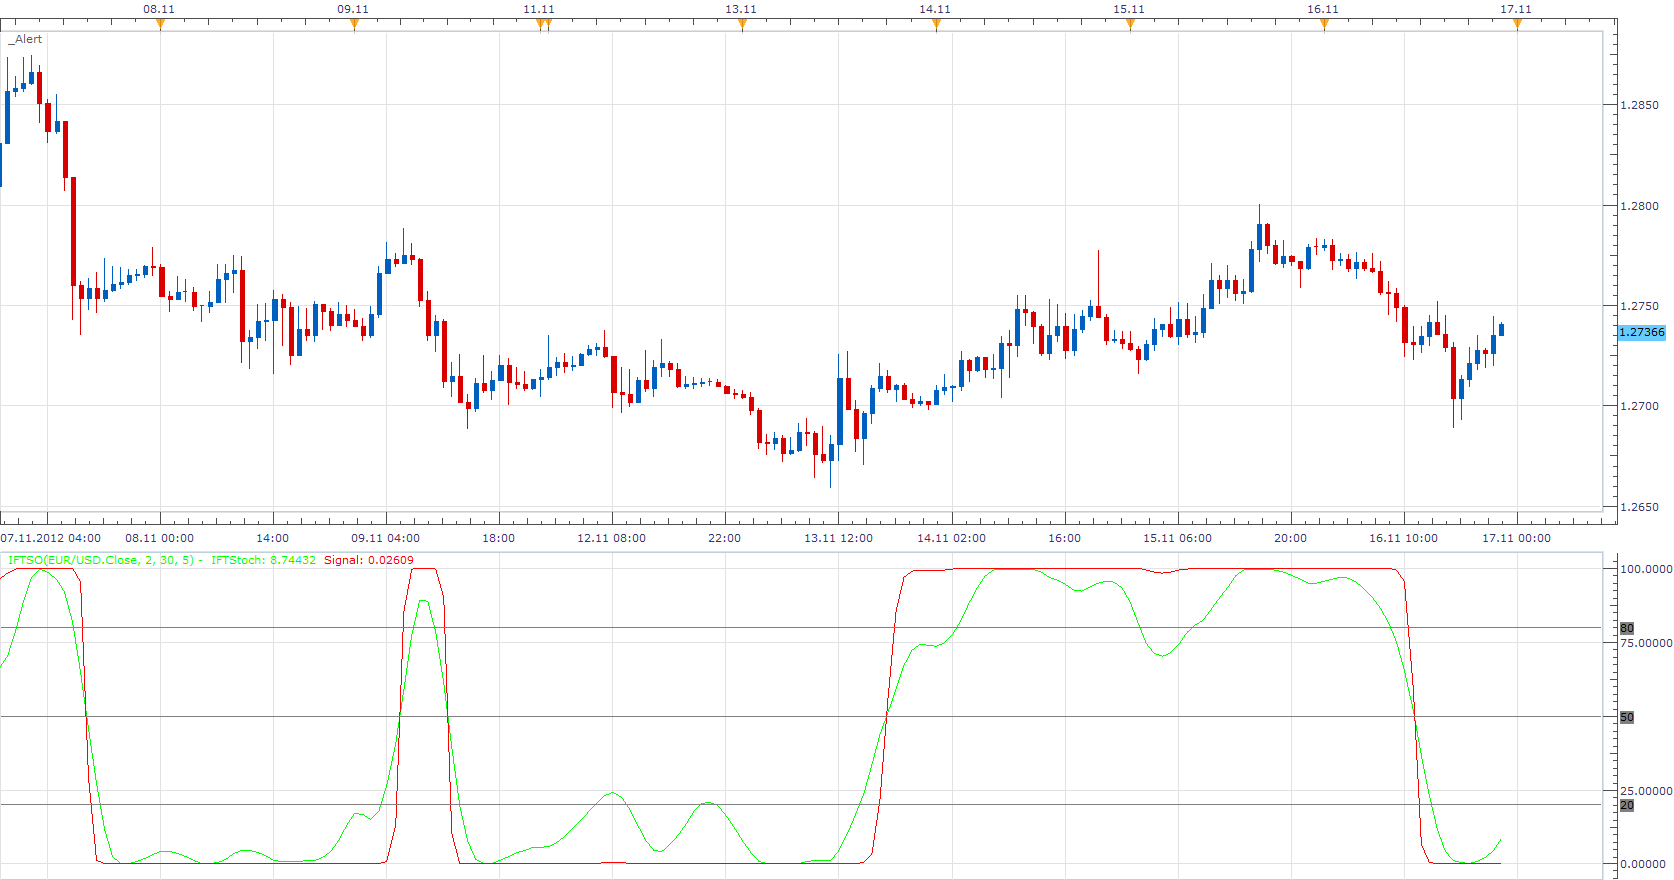
As described in 2011 December issue of Stocks & Commodities magazine.
The indicator was revised and updated
Re: Inverse Fisher Transform Stochastic Oscillator
transformer · Tue Nov 20, 2012 6:36 am
this is very nice indicator.
can u create strategy based on this indicator with cci filtration
strategy name : IFTSO CCI STRATEGY
indicators used:
-
IFTSO with default parameters buy level: 20 sell level: 80
-
cci (period 200) buy level: 0 sell level: 0
buy: cci> buy level(0) and IFTSO signal line cross over buy level (20) sell: cci< sell level(0) and IFTSO SIGNAL LINE cross under sell level(80)
Re: Inverse Fisher Transform Stochastic Oscillator
Apprentice · Tue Nov 20, 2012 9:06 am
Requested can be found here. viewtopic.php?f=31&t=26326 I added some optional exit options.
Re: Inverse Fisher Transform Stochastic Oscillator
Coondawg71 · Sat Apr 13, 2013 12:21 pm
Can we please offer an alteration to this indicator.
I wish to plot the indicator directly on the price chart…which works for instrument pairs whose price is under 100, obviously this is because it fits within the indicator scale. Hence, my request is to alter the maximum boundry upwards such as 160 or even 200 if need be. A good example to test against would be the GBP/JPY pair which currently sits within the 150.00 price handle.
I offer a snapshot of the NZD/JPY pair with the indicators as normally used under the price chart in an inferior window PLUS the manner in which I place this indicator in the superior window of the price chart.
thanks,
sjc
Re: Inverse Fisher Transform Stochastic Oscillator
Apprentice · Mon Apr 15, 2013 6:03 am
Your request is added to the development list.
Re: Inverse Fisher Transform Stochastic Oscillator
Apprentice · Fri May 12, 2017 6:36 am
Indicator was revised and updated.