fxcodebase-backup
Level and Strength
Source: https://fxcodebase.com/code/viewtopic.php?f=17&t=76179
Forum: 17 · Topic 76179 · 3 post(s)
Level and Strength
Apprentice · Wed Jul 23, 2025 10:40 am
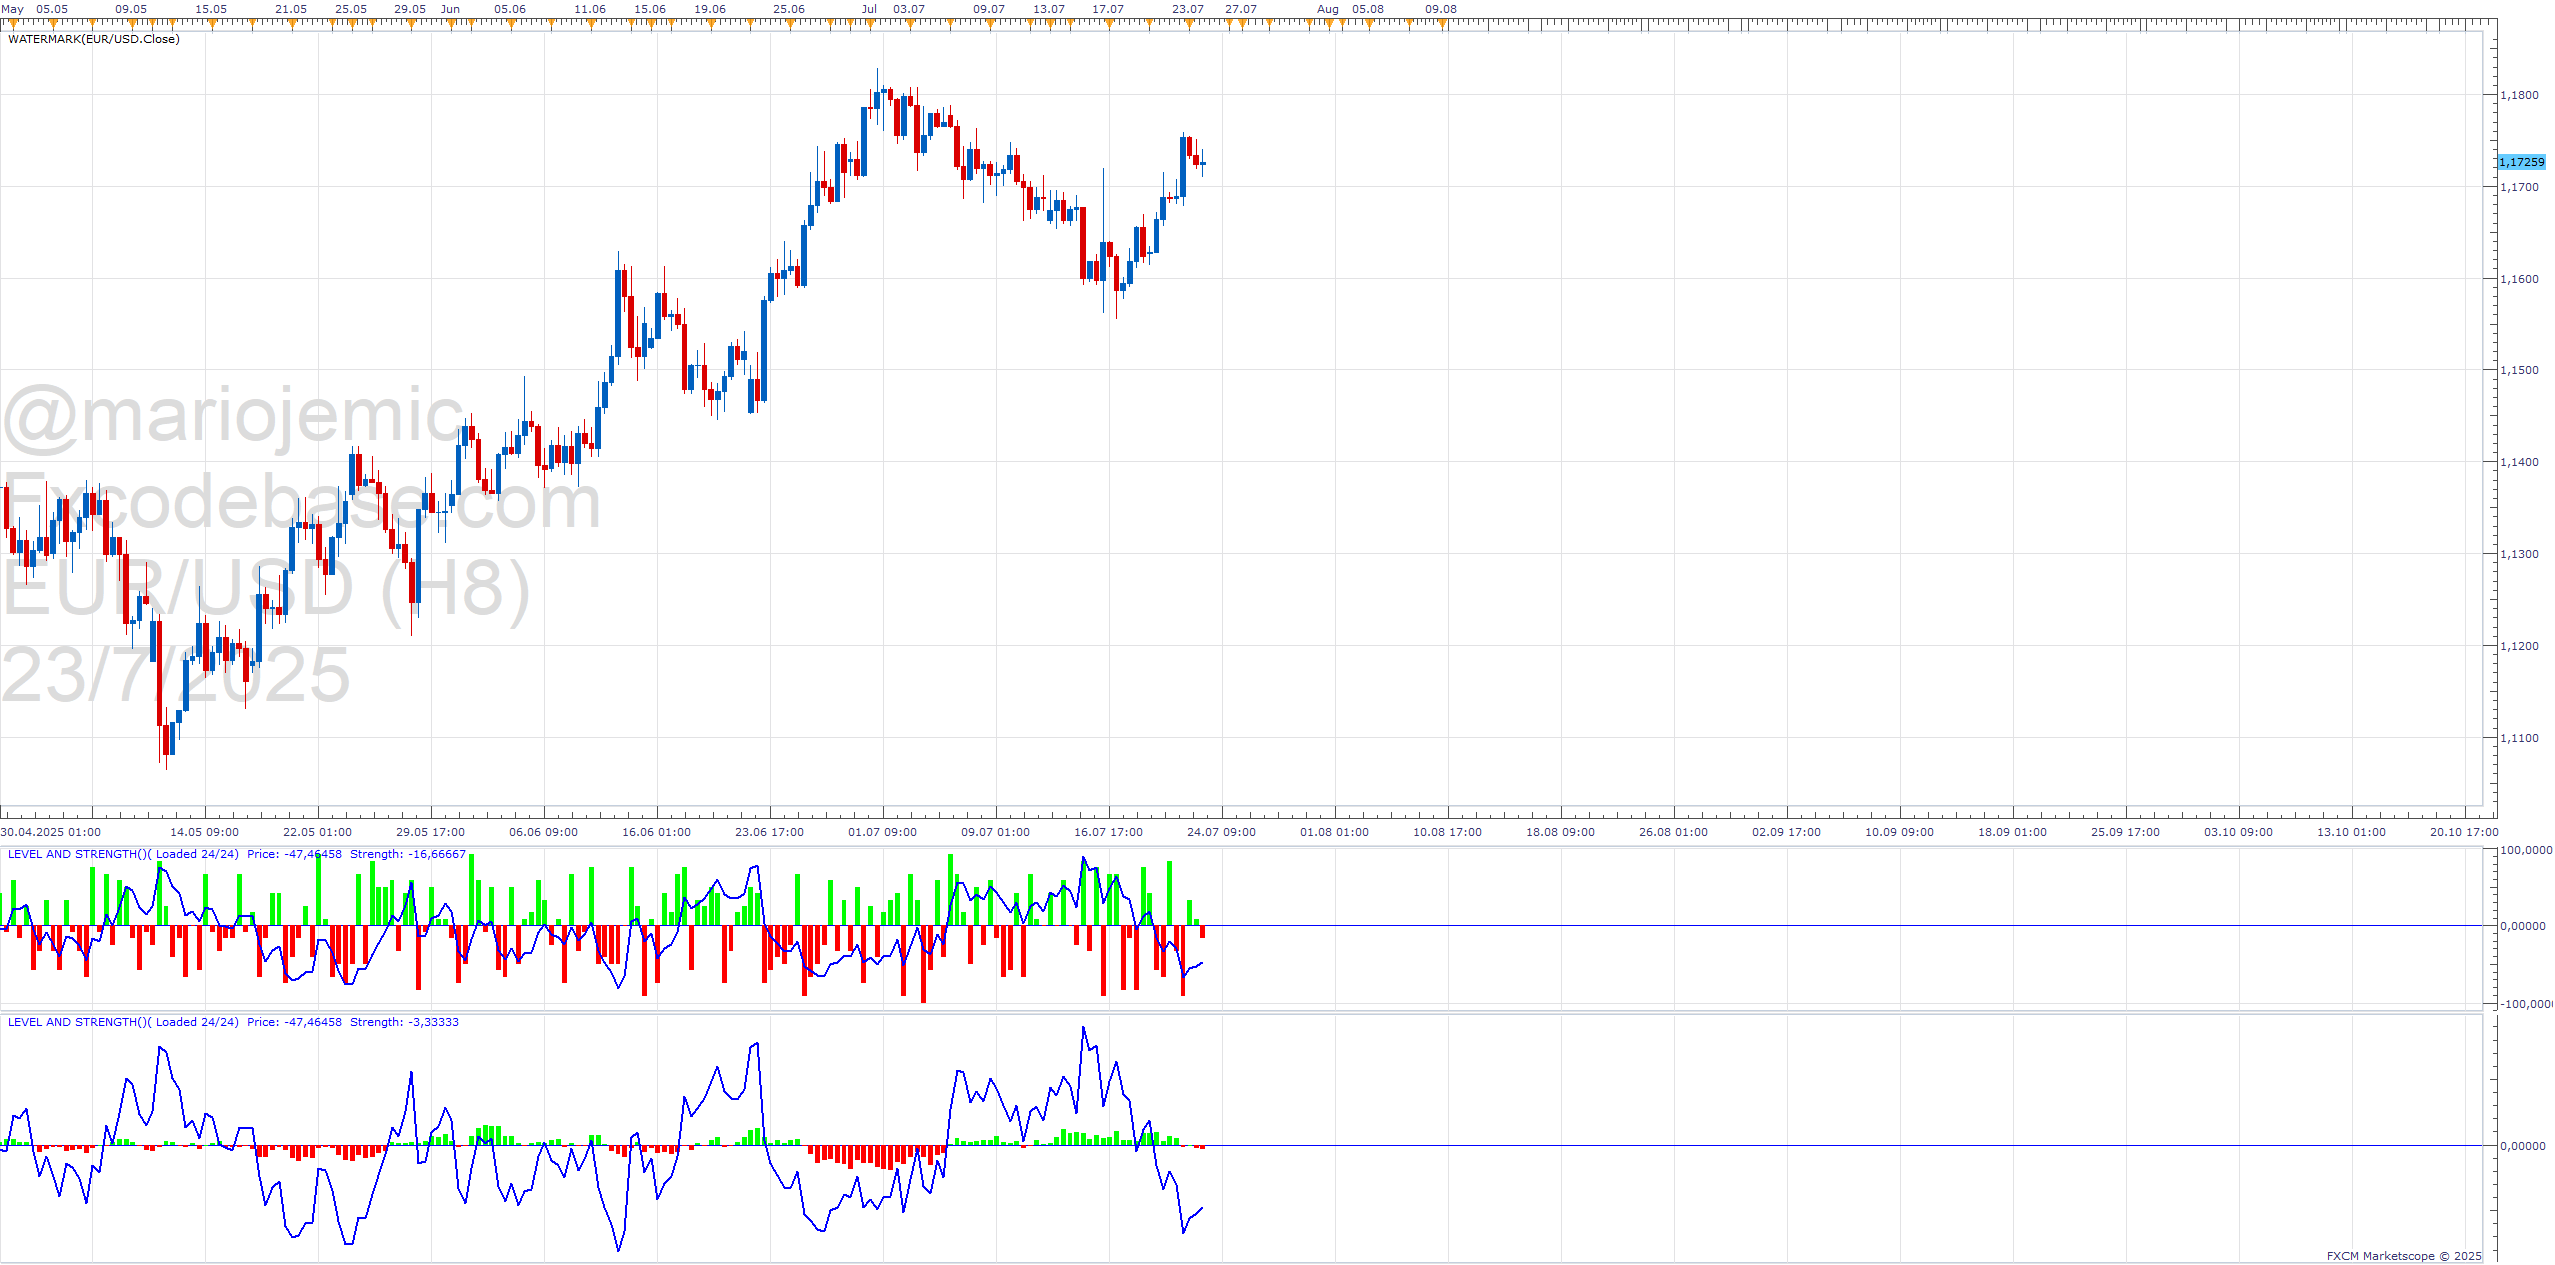
Level and Strength
This indicator measures the directional bias and strength of a selected currency by aggregating data from all active currency pairs that include it.
Core components: 1. Price Level – Normalized deviation of price from its dynamic range across all relevant pairs. 2. Directional Strength – Percentage of up vs. down candles across those pairs, scaled from -100 to +100.
The result is a composite and normalized view of whether the selected currency is gaining or losing ground – and how strong that directional move is.
Note: The indicator supports pairs in the format XXX/YYY where at least one of the currencies is USD, EUR, GBP, AUD, NZD, or JPY.
Re: Level and Strength
Apprentice · Thu Aug 07, 2025 12:04 pm
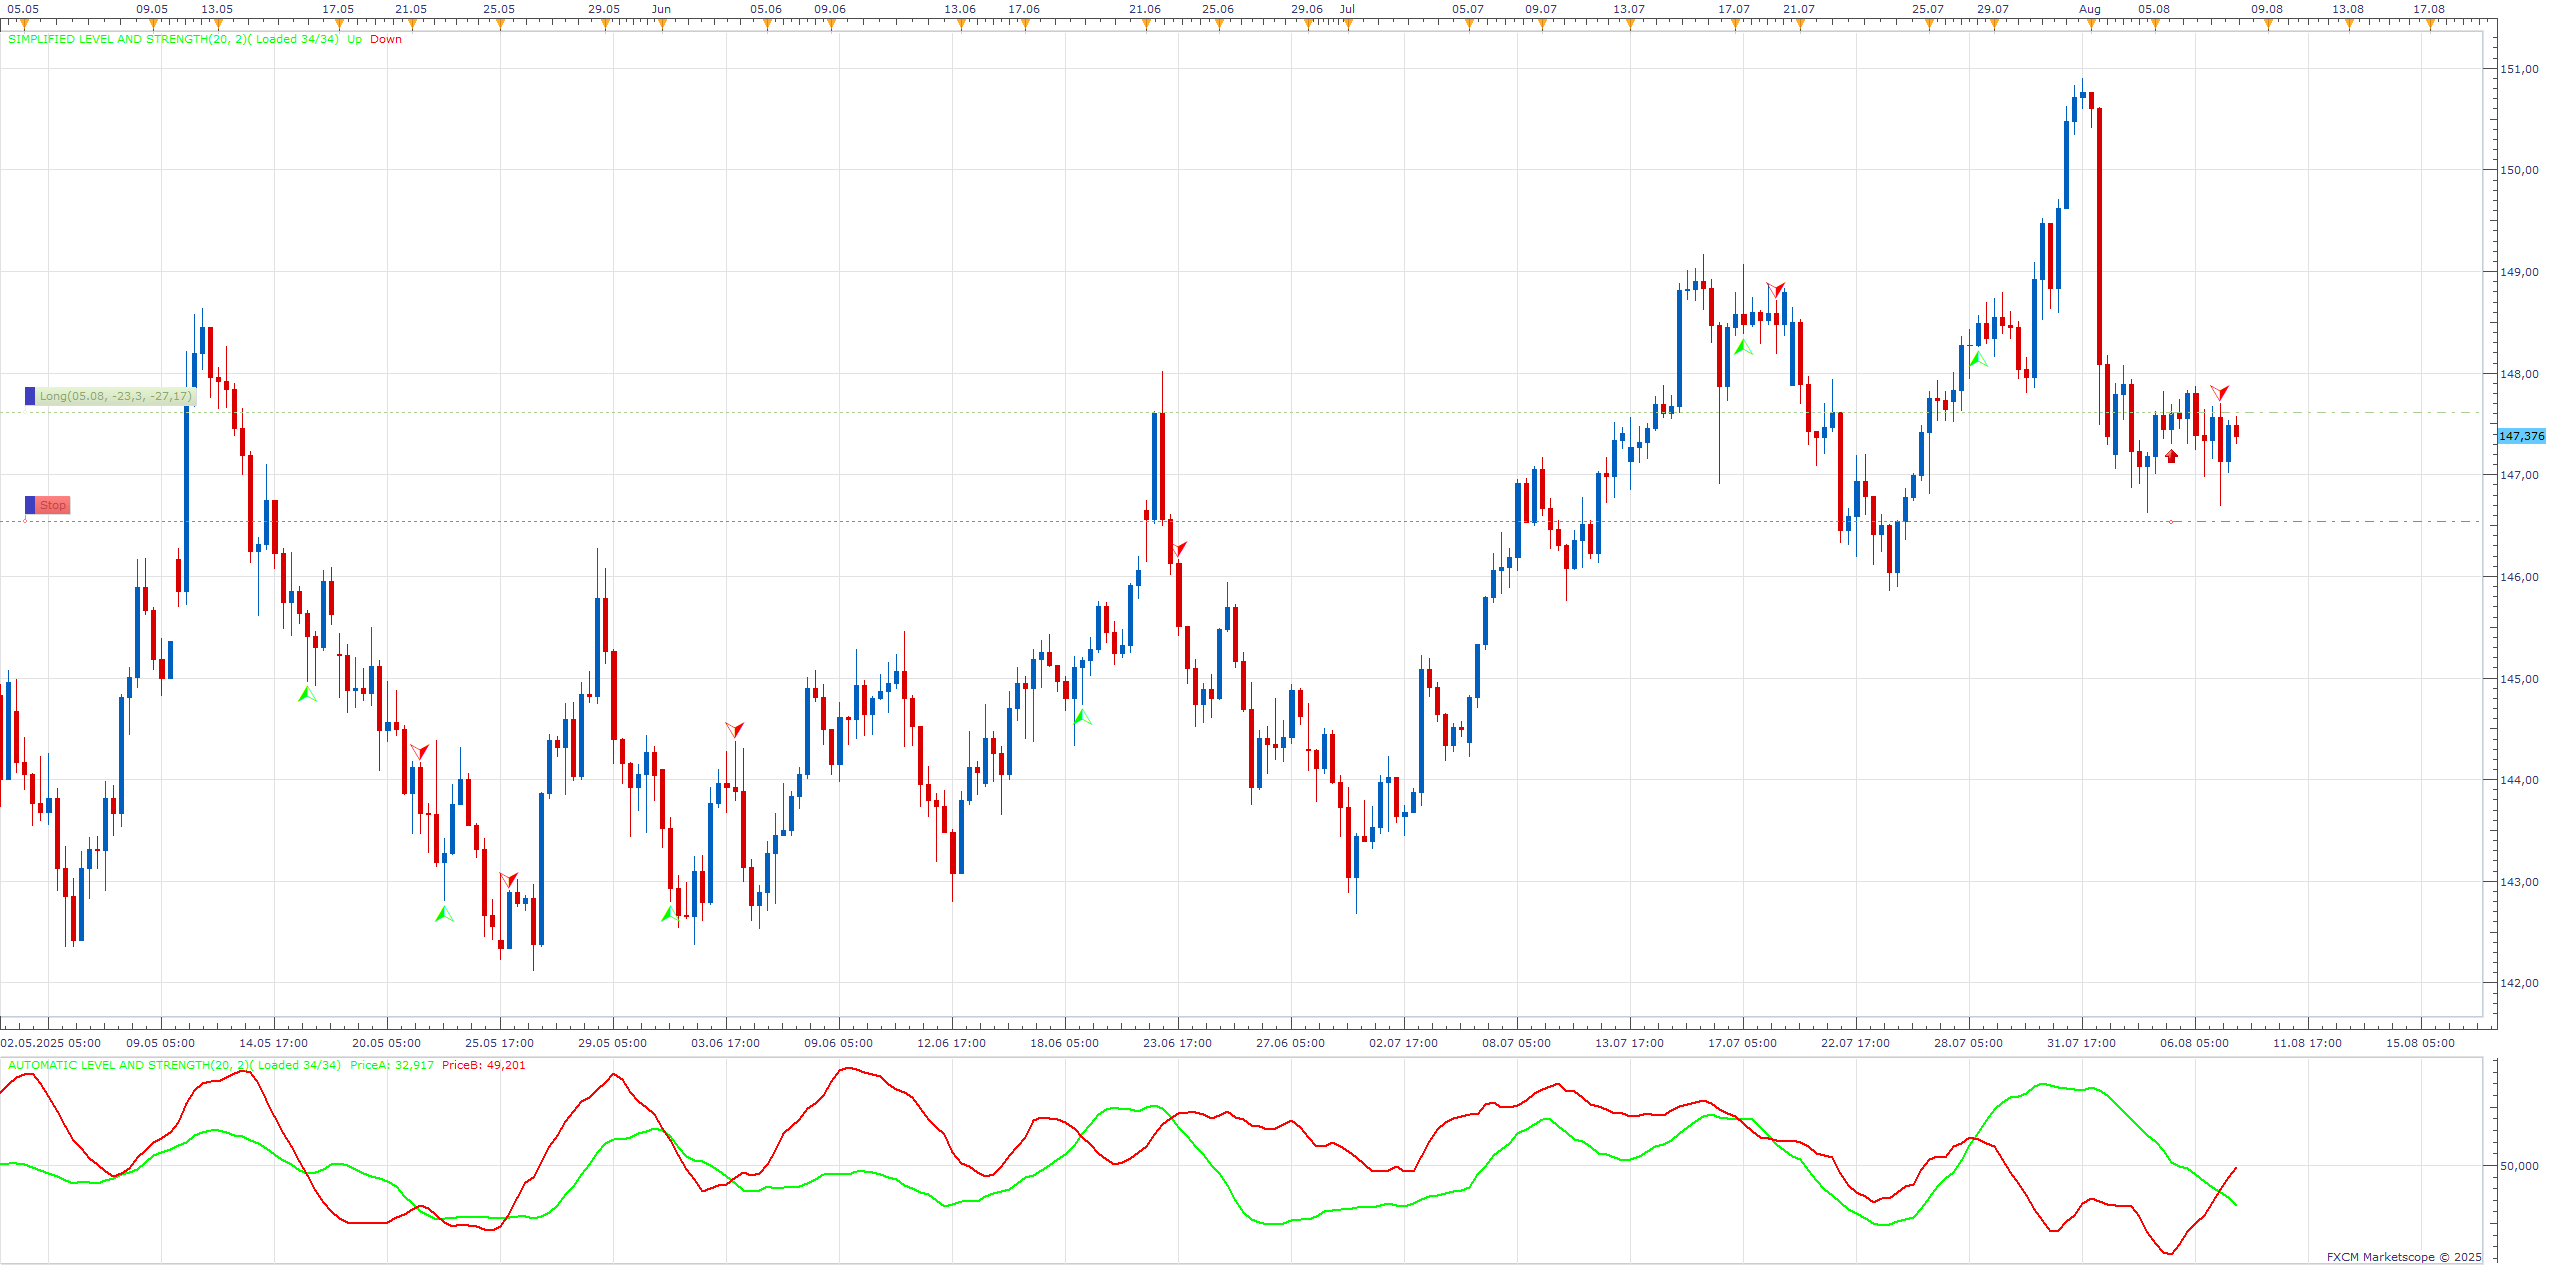
Automatic Level and Strength Automatically selects the instrument based on the active chart. It shows level and strength data without requiring manual setup. Useful for quick visual analysis.
Simplified Level and Strength Provides clear Buy/Sell signals that can be accessed from strategies. Designed for integration into automated trading systems
Automatic Level and Strength.lua
Simplified Level and Strength.lua
Level and Strength Pivots
Apprentice · Thu Aug 07, 2025 3:02 pm
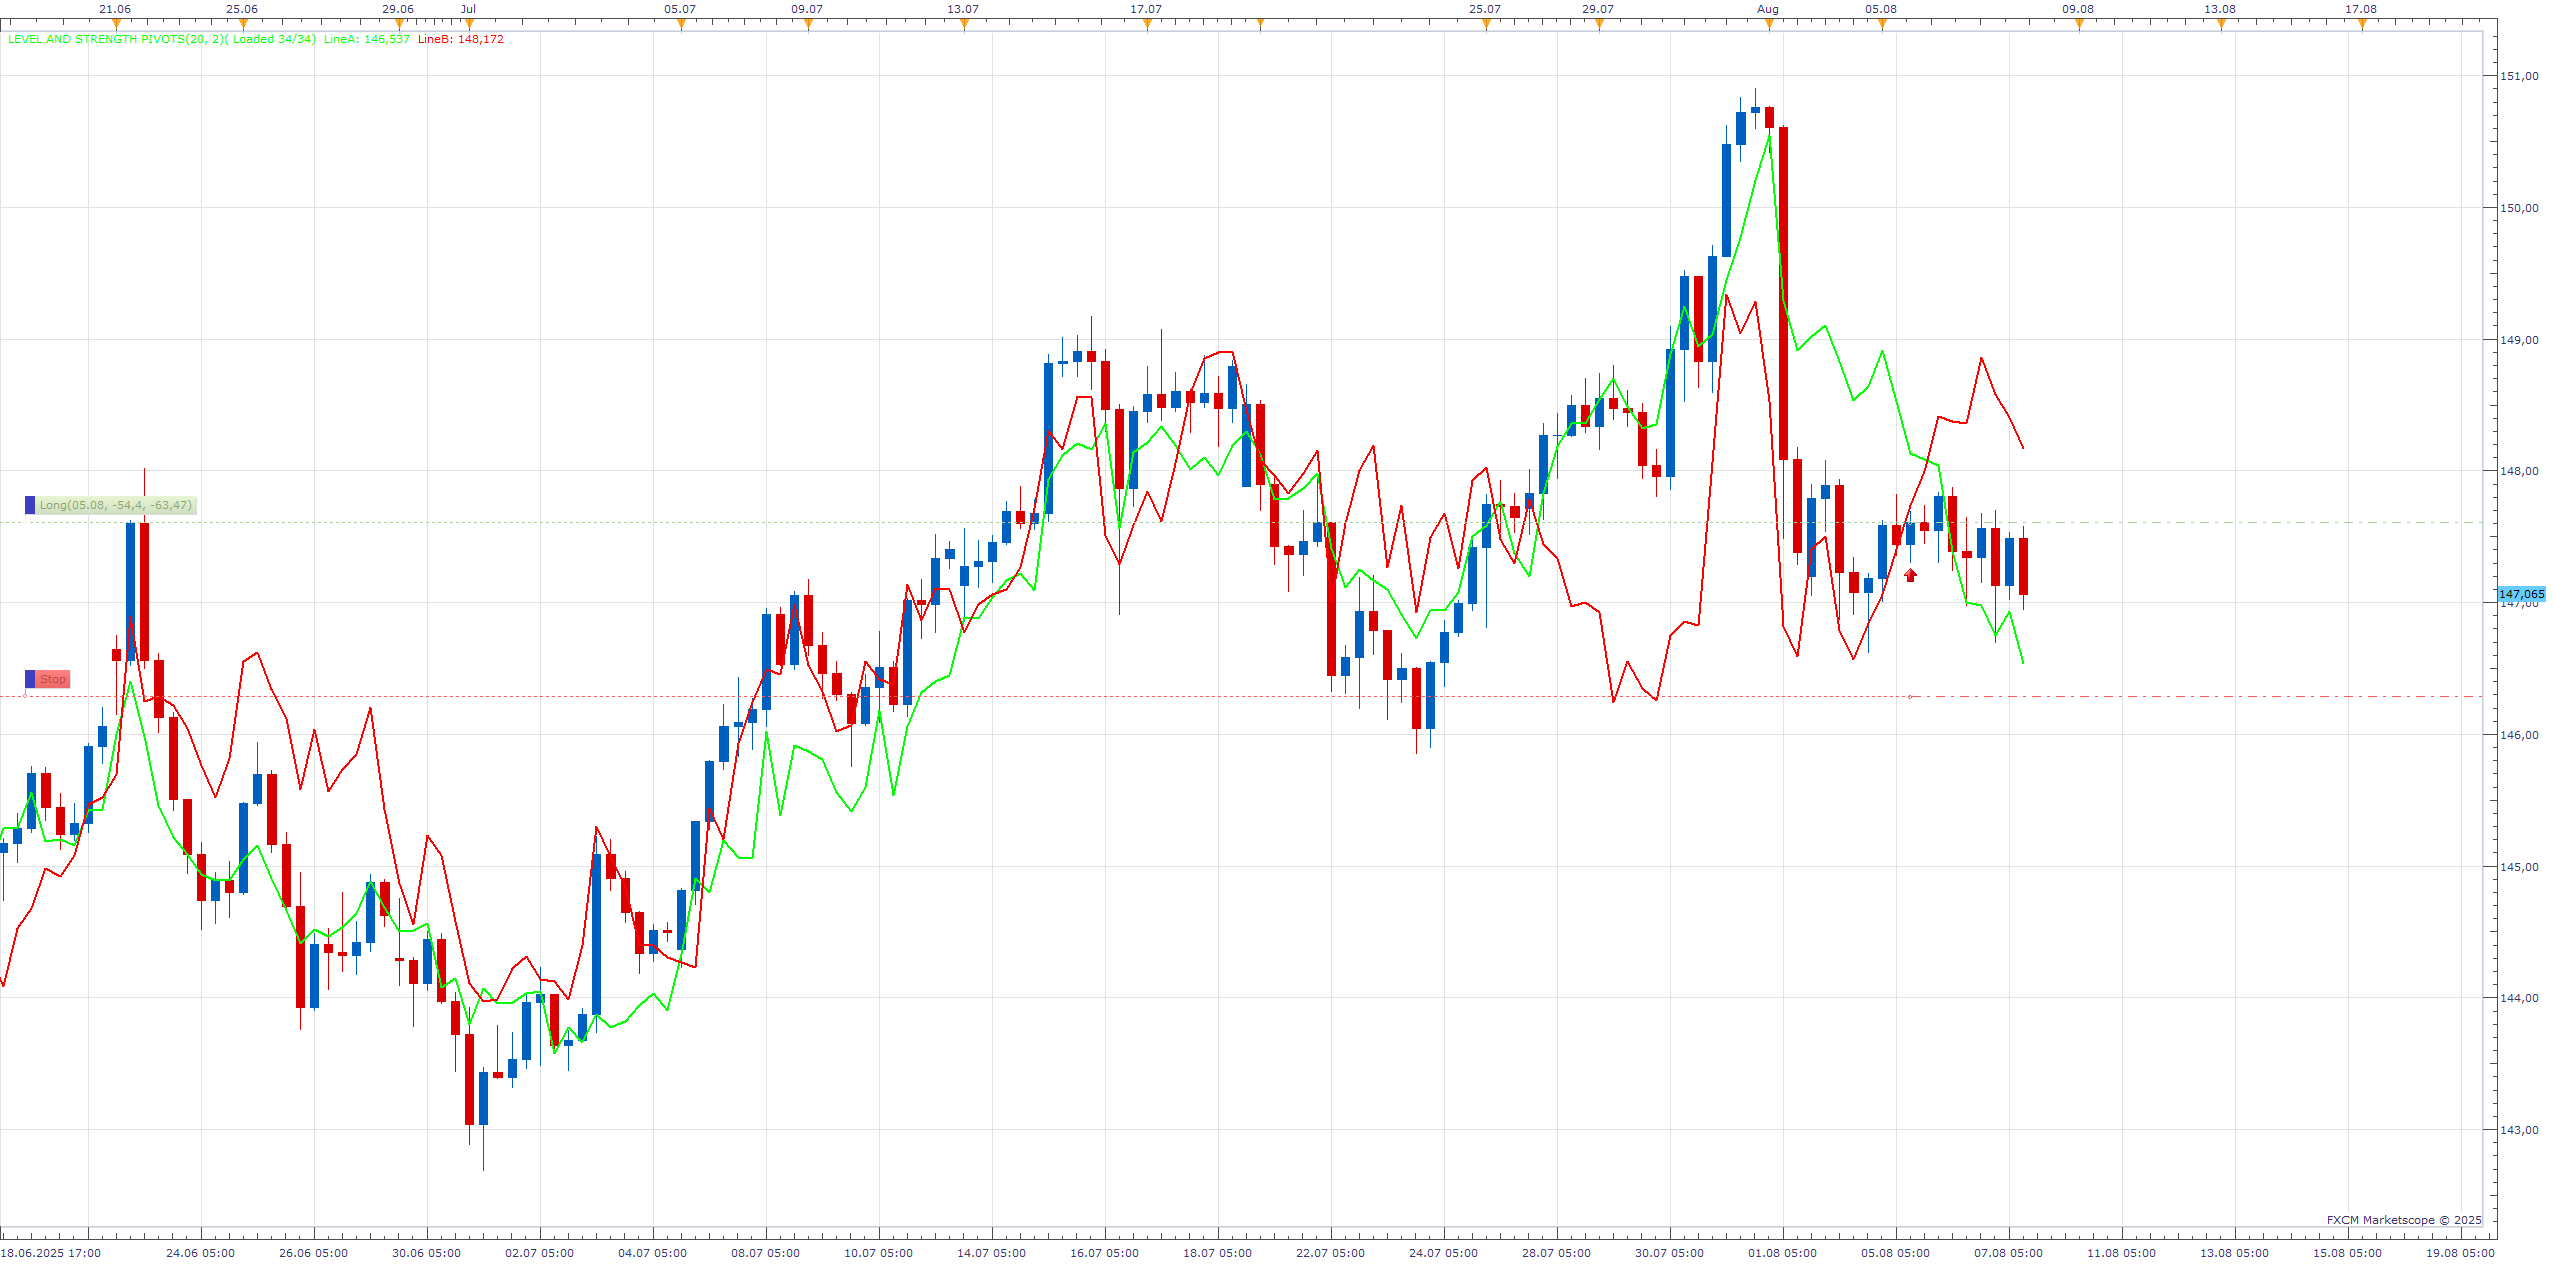
Purpose This indicator measures the relative strength of the two currencies in a currency pair by comparing how each currency performs against other instruments it’s part of, using Bollinger Band positioning as the proxy for strength or weakness. It visually displays two pivot lines on the main chart for each currency in the pair.
Core Logic Detects the base and quote currency (e.g., for EUR/USD → EUR and USD).
Scans all available instruments and selects only those where either base or quote currency is part of the selected symbol.
Determines the position of the price within the Bollinger Band (as a % between lower and upper bands).
Aggregates these % positions separately for: Instruments where the base currency is involved. Instruments where the quote currency is involved. Averages are optionally smoothed (Average = true).
These % strength values are mapped onto the Bollinger Band of the main instrument and used to draw: LineA = strength of base currency LineB = strength of quote currency
Visualization The two lines (LineA and LineB) are drawn within the Bollinger Band channel of the main symbol, showing where each currency would land if its average relative strength were projected onto the same BB channel.
Key Concept Used Multi-instrument relative strength via Bollinger Band placement