fxcodebase-backup
Logarithmic regression
Source: https://fxcodebase.com/code/viewtopic.php?f=17&t=3716
Forum: 17 · Topic 3716 · 8 post(s)
Logarithmic regression
Alexander.Gettinger · Wed Mar 23, 2011 9:43 pm
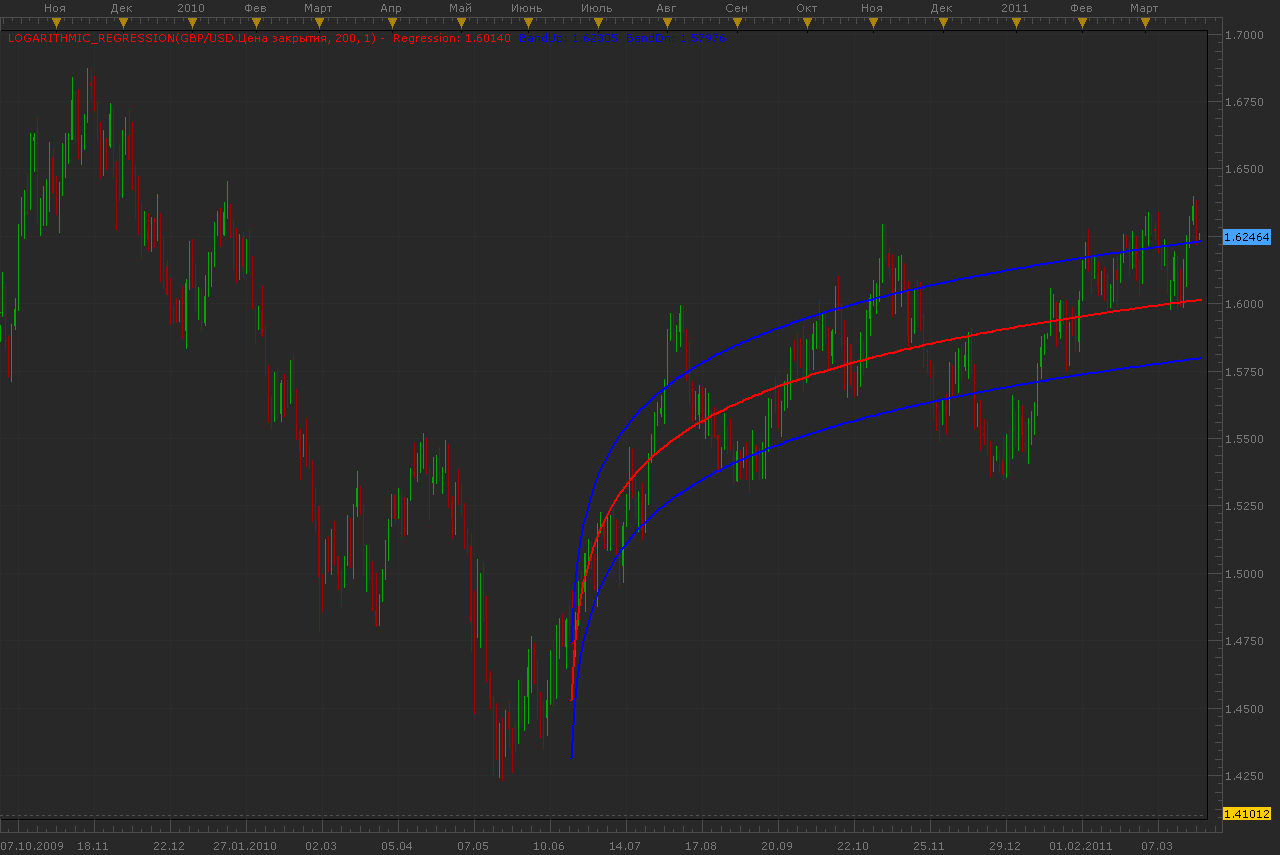
Indicator looks like Polynomial regression (viewtopic.php?f=17&t=3715), but instead of polynomial use a logarithmic function.
Download:
The indicator was revised and updated
Re: Logarithmic regression
mfoste1 · Sun Apr 24, 2011 7:02 pm
this log regression as well as the polynomial regression would probably make excellent algorithmic strategies.
-enter short if price exceeds upper line by N number of pips.
-enter long if price exceeds bottom line by N number of pips.
parameters
lot sizing allowed side stop and limit time period allowed to trade as specified by user
Re: Logarithmic regression
Apprentice · Mon Apr 25, 2011 4:14 am
Your request has been added to developmental cue.
Re: Logarithmic regression
Alexander.Gettinger · Thu Apr 28, 2011 12:00 am
mfoste1 wrote: this log regression as well as the polynomial regression would probably make excellent algorithmic strategies.
-enter short if price exceeds upper line by N number of pips.
-enter long if price exceeds bottom line by N number of pips.
parameters
lot sizing allowed side stop and limit time period allowed to trade as specified by user
This strategy you may find here: viewtopic.php?f=31&t=4050
Re: Logarithmic regression
TakisGen · Tue Jun 14, 2011 4:35 am
Hi,
Is it possible to modify the algorithm so that it works with negative streams too?
Thnx in advance Takis
Re: Logarithmic regression
Flemming_Dall · Thu Jul 14, 2011 6:18 am
What time scale is the best for this signal…?
15min, 2hours, 4hours… etc.?
I also tried the Polynominal regresion signal and sometimes they tell me to in to opposite directions.
The Logarithmic seems to work fine in a 15 min timechart?
Thanks !
Re: Logarithmic regression
Alexander.Gettinger · Fri Jun 29, 2012 1:36 pm
MQL4 version of this indicator: viewtopic.php?f=38&t=20676
Re: Logarithmic regression
Apprentice · Tue Apr 04, 2017 6:07 am
Indicator was revised and updated.