fxcodebase-backup
MA Histogram and Slope Line
Source: https://fxcodebase.com/code/viewtopic.php?f=17&t=75920
Forum: 17 · Topic 75920 · 1 post(s)
MA Histogram and Slope Line
Apprentice · Thu May 08, 2025 5:21 am
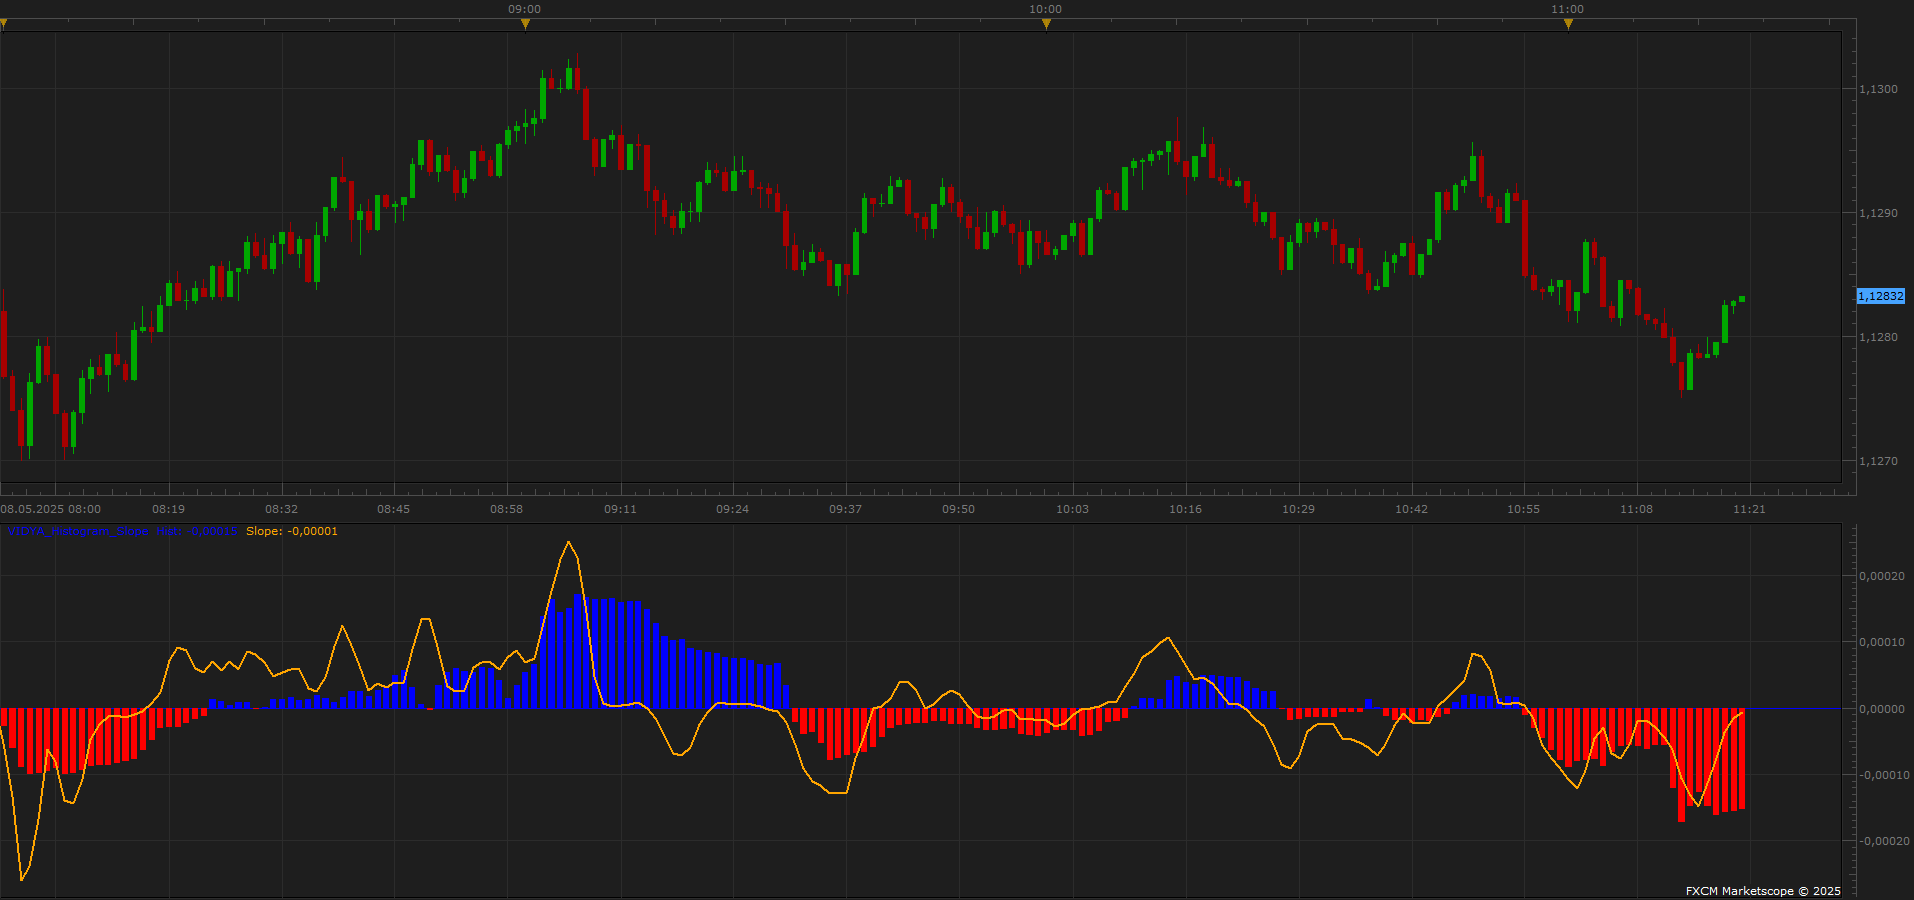
Based on the request. https://fxcodebase.com/code/viewtopic.p … 84#p159184
Histogram
Displays the difference between MA1 and MA2
Dynamically colors the bars:
Blue (UpColor) when value > 0
Red (DownColor) when value < 0
Slope Line
Shows the slope calculated as: MA2[period] - MA2[period - Shift]
Plotted with user-defined color, width, and style.