fxcodebase-backup
Market Indexes on the chart [Upd Aug 27]
Source: https://fxcodebase.com/code/viewtopic.php?f=17&t=611
Forum: 17 · Topic 611 · 8 post(s)
Market Indexes on the chart [Upd Aug 27]
Nikolay.Gekht · Sun Apr 11, 2010 8:45 pm
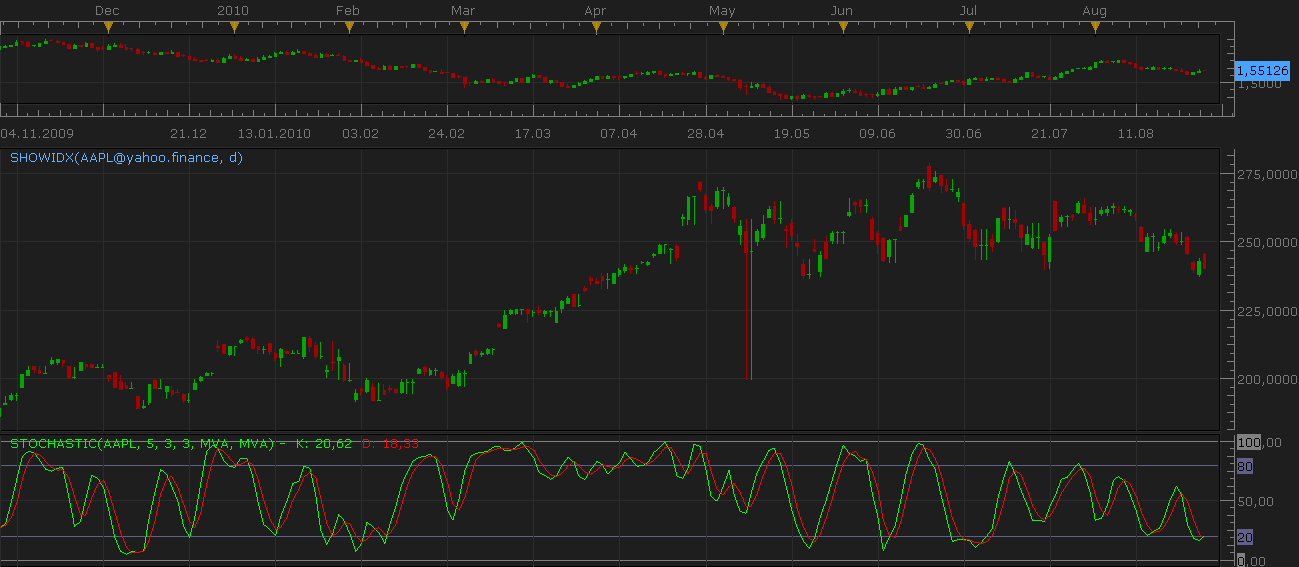
The indicator shows one of the following indexes with 1 day, 1 week or 1 month time-frame. The indexes are: Dow Jones NASDAQ S&P 500 FTSE 100 10 Year bonds Bel-20 CAC 40
[new Aug 27 2010] You can also choose “Custom” in the index selector and then enter the name of the instrument into “custom instrument” parameters. Try, for example AAPL (Apple)
[new Aug 27 2010] You don’t need to choose the timeframe in the indicator anymore. The indicator detects the timeframe automatically.
How to use:
1) Open 1 day, 1 week or 1 month chart of any forex instrument. 2) Apply the showidx oscillator.
The stock data will be shown below the instrument chart.
The result of the oscillator is a set of regular candles, so, you can apply any indicators on these data (to apply the indicator just choose the instrument on the source tab of the indicator properties).
Download:
Please add this ddl to your TS folder.
The source of the data is Yahoo! Finance.
Re: Market Indexes on the chart [Upd Aug 27]
Nikolay.Gekht · Sat Aug 28, 2010 10:17 pm
Updated Aug, 27: 1) The timeframe parameter is removed. Now the indicator detects it automatically. 2) The volume is supported. 3) The custom instruments are supported.
Re: Market Indexes on the chart [Upd Aug 27]
Outside_The_Box · Tue Nov 12, 2013 2:23 am
The 10 year bonds are the interest rate, not the bonds themselves, just FYI. Still, very cool!
I’m going to have some fun with that etraderzone link.
Re: Market Indexes on the chart [Upd Aug 27]
Apprentice · Mon Jun 19, 2017 5:06 am
The indicator was revised and updated.
Re: Market Indexes on the chart [Upd Aug 27]
mayk01 · Fri Oct 08, 2021 6:30 am
Hi ! Can I request an update? The yahoo web address does not work so the indicator does.
Thanks, M.
Re: Market Indexes on the chart [Upd Aug 27]
mayk01 · Fri Oct 08, 2021 6:48 am
Hi,
Is it possible to upgrade? The yahoo link doesn’t work.
Thanks, M.
Re: Market Indexes on the chart [Upd Aug 27]
Apprentice · Sun Oct 10, 2021 3:49 am
Your request is added to the development list. Development reference 900.
Re: Market Indexes on the chart [Upd Aug 27]
Apprentice · Thu Nov 25, 2021 10:41 am
Updated.