fxcodebase-backup
Min Max Cycle
Source: https://fxcodebase.com/code/viewtopic.php?f=17&t=64556
Forum: 17 · Topic 64556 · 19 post(s)
Min Max Cycle
Apprentice · Thu Mar 30, 2017 9:01 am
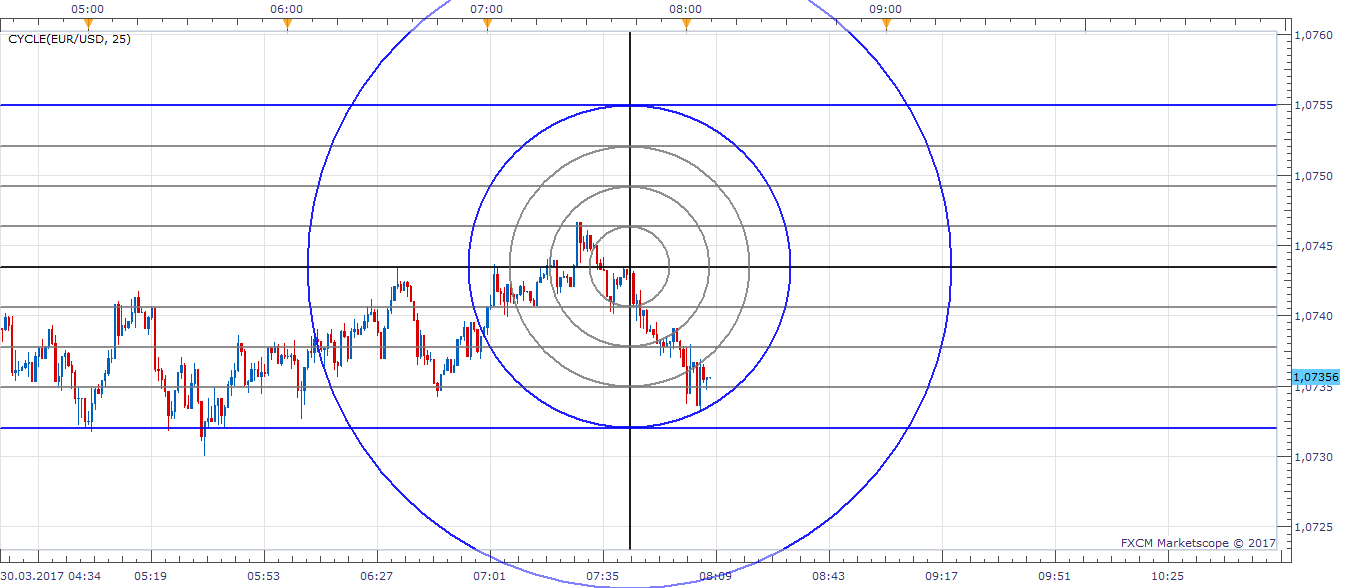
Referent 100% circle is drawn based on Period Min / Max value.
The indicator was revised and updated
Re: Min Max Cycle
jaricarr · Thu Oct 12, 2017 11:52 am
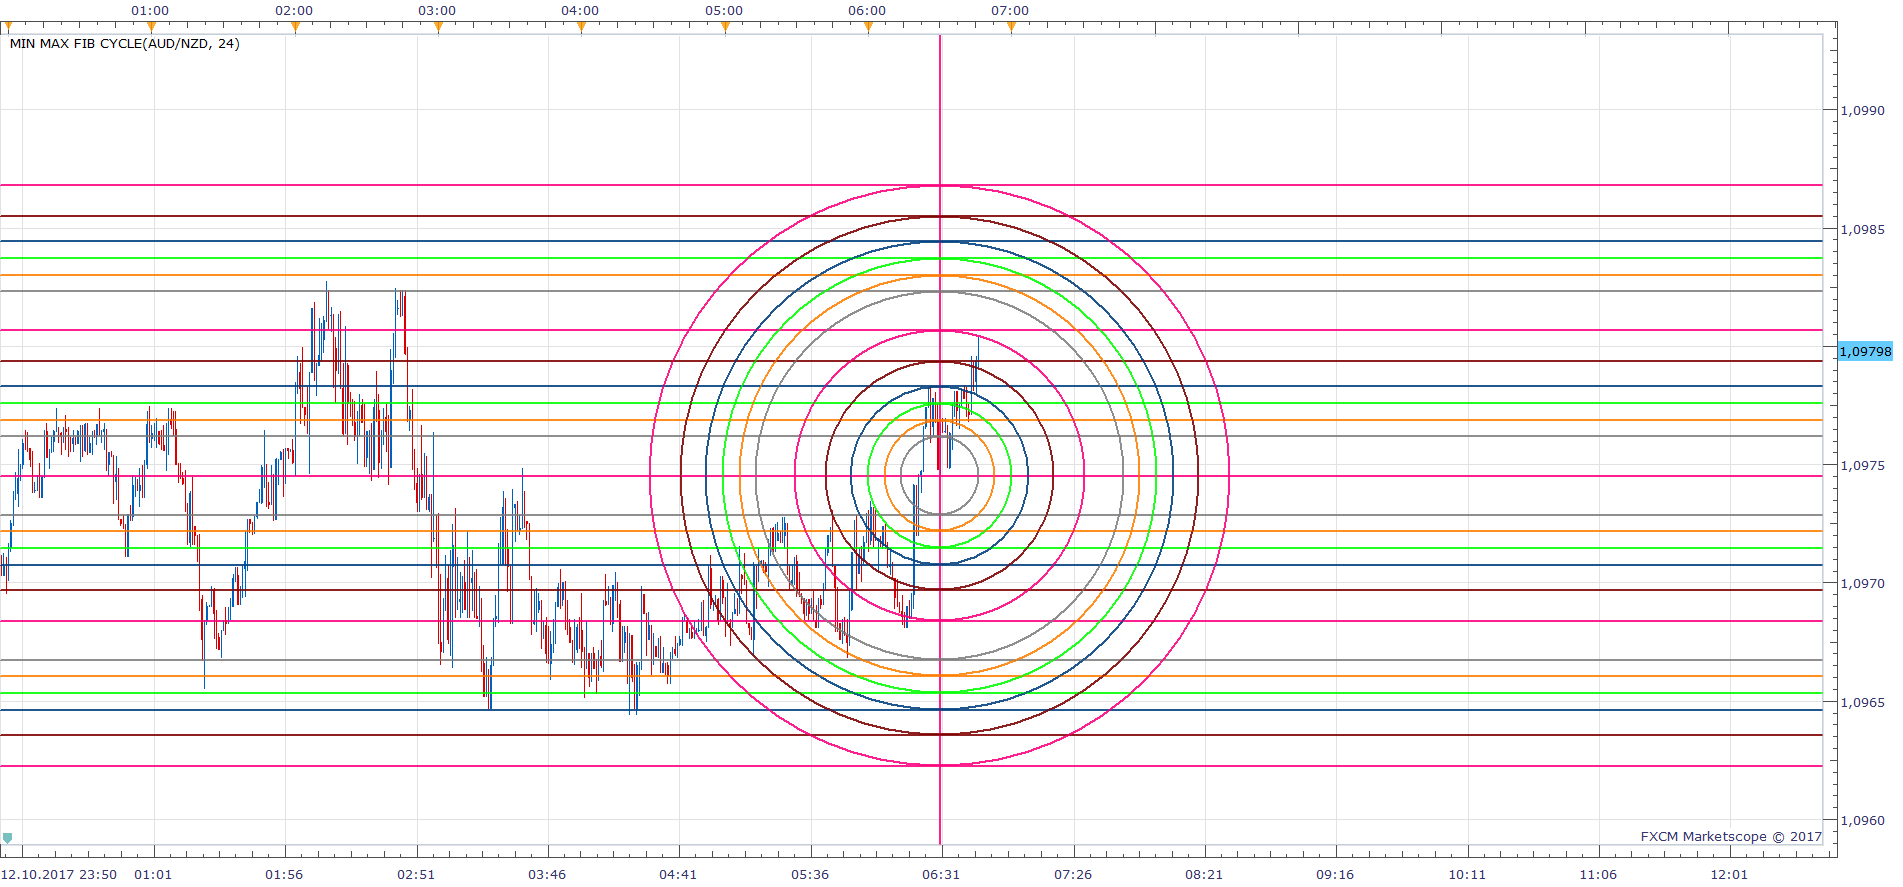
Hello Apprentice,
Here is my attempt to make a version using fib numbers.
Re: Min Max Cycle
Apprentice · Fri Oct 13, 2017 7:39 am
Fixed.
Re: Min Max Cycle
High&Low · Fri Oct 27, 2017 6:25 pm
Hi,
Thanks for the indicator.
Can you modify the indicator :
The starting point (Center of the Circle) can be set and the period which is used for radius can be defined by clicking on the high and low of the swing ?
http://tinypic.com/r/2roq0ic/9
For example, in the picture, we click on the candle which is written Center and the center is set. and for the radius, we use high A and Low B . And it can be set by choosing the candle and clicking on it. For the bigger circles, define a R2= R1 * X1 ( I mean R2= R1 multiple X and X can be Decimal or integer) , also for R3, R4, R5, R6 R3= R1X2 R4= R1X3 ….
Thanks
Re: Min Max Cycle
Apprentice · Sat Oct 28, 2017 4:07 am
Your request is added to the development list under Id Number 3930
Re: Min Max Cycle
Apprentice · Mon Oct 30, 2017 10:11 am
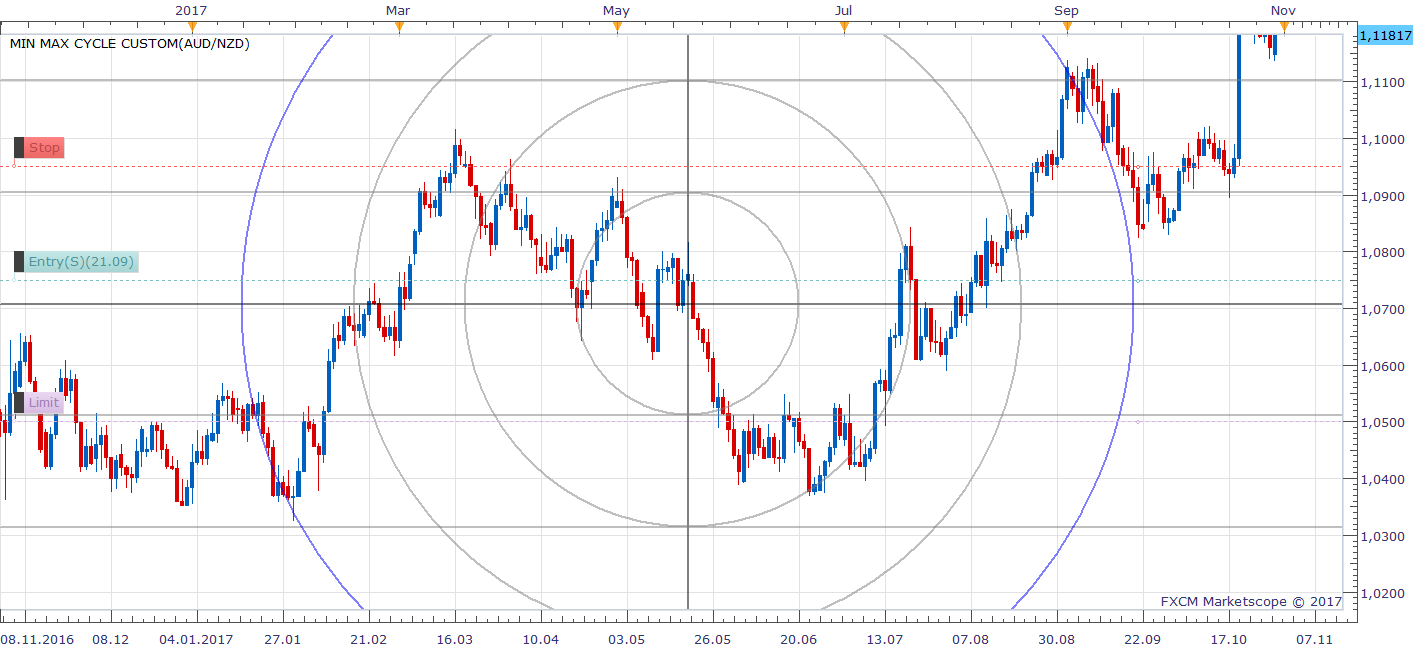
Re: Min Max Cycle
High&Low · Tue Oct 31, 2017 4:10 pm
Thank you, you nailed it.
Can you modify it as in the picture.
http://tinypic.com/r/10hrs51/9
thanks,
Re: Min Max Cycle
Apprentice · Thu Nov 02, 2017 5:06 pm
Try it now.
Re: Min Max Cycle
High&Low · Fri Nov 03, 2017 12:36 am
Thank you for your time and effort
Re: Min Max Cycle
High&Low · Sun Nov 05, 2017 3:57 pm
Can you check the pictures below ? Is it possible to modify it based on the questions on the picture
Picture 1:
http://tinypic.com/r/2sbvhqo/9
Picture 2:
Thank you
Re: Min Max Cycle
Apprentice · Mon Nov 06, 2017 4:36 am
Circle location is set to date. If this time frame is changed, circle locations will change accordingly. If R is defined in pips or pixels, we will have the discontinuity with price action.
Re: Min Max Cycle
High&Low · Mon Nov 06, 2017 4:57 pm
Thank you for the reply and your explanation. In the last two pictures I did not change the timeframe but I changed the zoom in the chart and the place of the circles changed. You are right, if we define the R based on a pips we will have the discontinuity with price action but I think there is way to prevent the discontinuity . It is as follows: If we define a scale for the R( radius) of the circles then the problem will be solved . The scale can be defined in a way that Radius = X/y X here is the high- low ( amount of pips between high and low that we define) and y is the conversion rate for the pips. For example if we assume that the amount of pips between high and low is 100 pips, and we give the conversion rate 10 the Radius is equal 100/10 = 10 bar it means the radius is 10 bar , but this radius has both price and time included. The conversion rate ( y) can be decimal or integer. Can modify the R and change it into Scale R and define the R= X/y and the rest R2,R3,,,, is based on the R. Thank you in advance .
Re: Min Max Cycle
High&Low · Wed Nov 08, 2017 3:31 pm
any help for modifying the indicator based on above explanation ?
Re: Min Max Cycle
Apprentice · Thu Nov 09, 2017 5:39 am
Your request is added to the development list under Id Number 3944
Re: Min Max Cycle
High&Low · Sat Nov 11, 2017 12:47 am
Hi Apprentice,
I found a better explanation than what I wrote above for scaling the chart, Please check the link below :
https://www.tradingview.com/chart/BTCUS … ur-charts/
Thanks in advance
Re: Min Max Cycle
High&Low · Fri Nov 24, 2017 3:46 pm
Hi,
Any update ? Please help if it is possible.
Thank you
Re: Min Max Cycle
Alexander.Gettinger · Tue Jan 16, 2018 3:42 pm
High&Low wrote: Hi,
Any update ? Please help if it is possible.
Thank you
Please, try this version of indicators. I added scale parameter.
Re: Min Max Cycle
High&Low · Sat Jan 20, 2018 11:27 pm
Hi,
Thank you for your help. I appreciate it.
Is it possible to add scale parameter to the custom indicator as well ?
viewtopic.php?f=17&t=64556#p115759
Re: Min Max Cycle
Apprentice · Mon Jan 22, 2018 5:53 am
Can you give me an example?