fxcodebase-backup
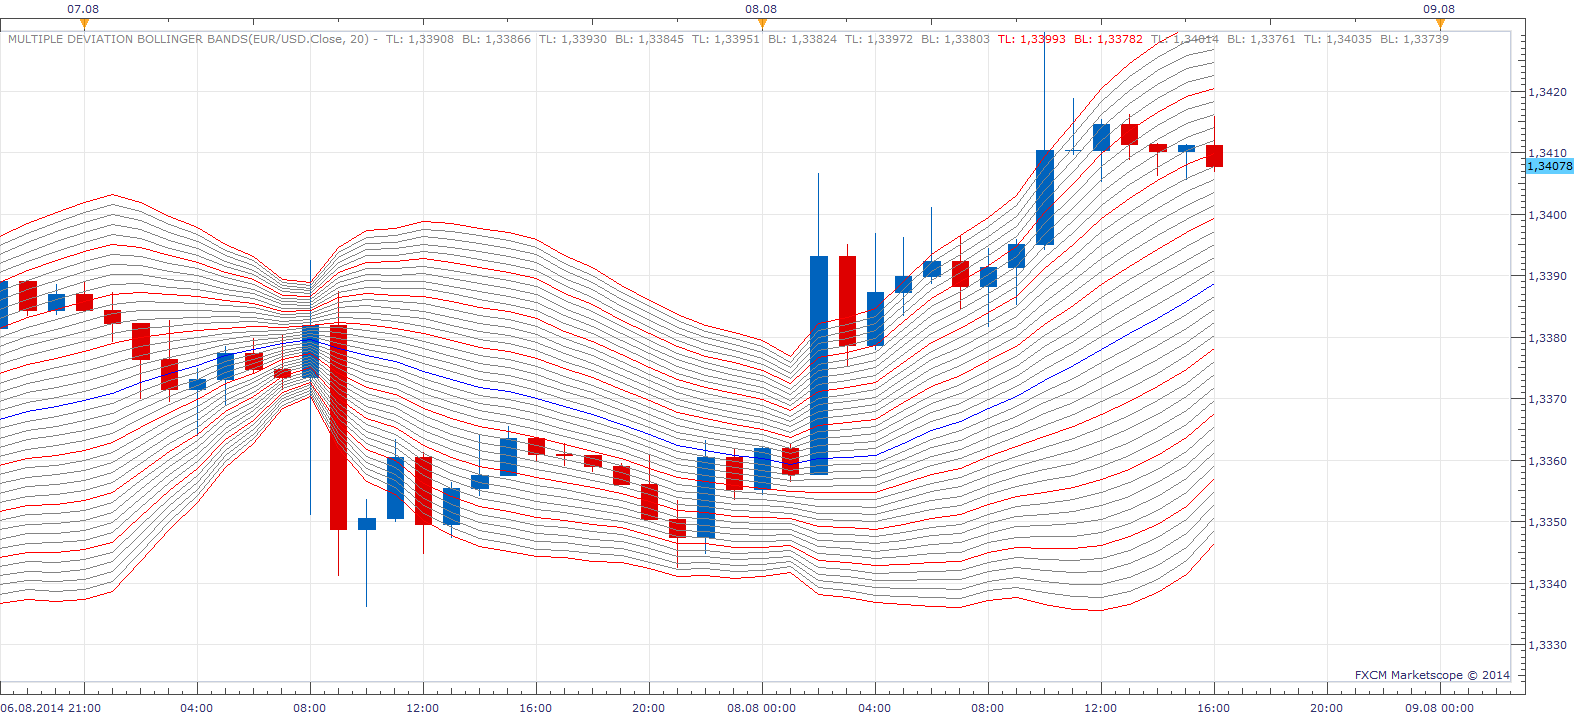
Multiple Deviation Bollinger Bands
Source: https://fxcodebase.com/code/viewtopic.php?f=17&t=61026
Forum: 17 · Topic 61026 · 14 post(s)
Multiple Deviation Bollinger Bands
Apprentice · Sat Aug 09, 2014 5:51 am
Multiple Deviation Bollinger Bands.lua
The indicator was revised and updated
Re: Multiple Deviation Bollinger Bands
speakinmymind · Sat Aug 09, 2014 9:13 am
Could you please add a number to the right of each line as an identifier?
Basically each line would have two numbers because the lines should be numbered 1 through 40 going down, and then 1 through 40 going up. So they would look like this: line 1 1 40 line 2 2 39 line 3 3 38 …………………
Thank you!
Re: Multiple Deviation Bollinger Bands
speakinmymind · Tue Aug 12, 2014 8:53 pm
On second thought, could you just put the deviation value and price next to each line?
Re: Multiple Deviation Bollinger Bands
Apprentice · Wed Aug 13, 2014 6:02 am
Show Labels parameter option Added.
Re: Multiple Deviation Bollinger Bands
speakinmymind · Sat Aug 16, 2014 1:06 pm
Can you create an alert/alarm for touch/cross of each line? Thanks
Re: Multiple Deviation Bollinger Bands
Apprentice · Wed Aug 20, 2014 2:03 pm
Your request is added to the development list.
Re: Multiple Deviation Bollinger Bands
speakinmymind · Tue Sep 02, 2014 3:57 pm
Could you please create a strategy for this?
Enter short when price hits a line above
Enter long when price hits a line below
User defined stops. Thank you.
Re: Multiple Deviation Bollinger Bands
Apprentice · Wed Sep 03, 2014 3:12 am
Curiosity, why do you need Multiple Deviation Bollinger Bands. Would regular Bollinger Bands strategy suffice.
Re: Multiple Deviation Bollinger Bands
speakinmymind · Wed Sep 03, 2014 3:06 pm
The multiple bollinger bands are needed because my strategy uses a very large moving average and the deviations of that moving average are entry points.
Thanks!
Re: Multiple Deviation Bollinger Bands
Apprentice · Thu Sep 04, 2014 11:29 am
U can set any Period Deviation for Bollinger Band Indicator .
Re: Multiple Deviation Bollinger Bands
speakinmymind · Thu Sep 04, 2014 11:54 pm
I understand that, but the lines I use for entry are the different deviations of that moving average. I don’t know ahead of time which deviation levels each currency is in between. I could in theory use a normal bollinger band strategy, but I would have to implement the strategy 20 times for each pair. Also I would have to set when to buy and sell differently.
Re: Multiple Deviation Bollinger Bands
speakinmymind · Fri Sep 05, 2014 8:15 am
Could you create a static version of this indicator?
Instead of the moving average, there should be a horizontal line the user can drag up and down. Once set, there should be 20 levels with a user defined distance between them.
This should basically look like the basic Fibbonacci tool, and the user is draging the zero level to the desired price. The distance between levels are predefined using pips, ATR, etc. and not percentage of moves between points.
The idea is to test different formulas to determine the predefined distance between levels. For example, the difference in pips between specified moving averages could be used.
Re: Multiple Deviation Bollinger Bands
Apprentice · Sun Sep 07, 2014 5:11 am
Requested can be found here. viewtopic.php?f=17&t=61107
Re: Multiple Deviation Bollinger Bands
Apprentice · Tue Jul 11, 2017 1:31 pm
The indicator was revised and updated.