fxcodebase-backup
Multitimeframe CCI
Source: https://fxcodebase.com/code/viewtopic.php?f=17&t=7638
Forum: 17 · Topic 7638 · 6 post(s)
Multitimeframe CCI
Apprentice · Wed Oct 26, 2011 3:01 pm
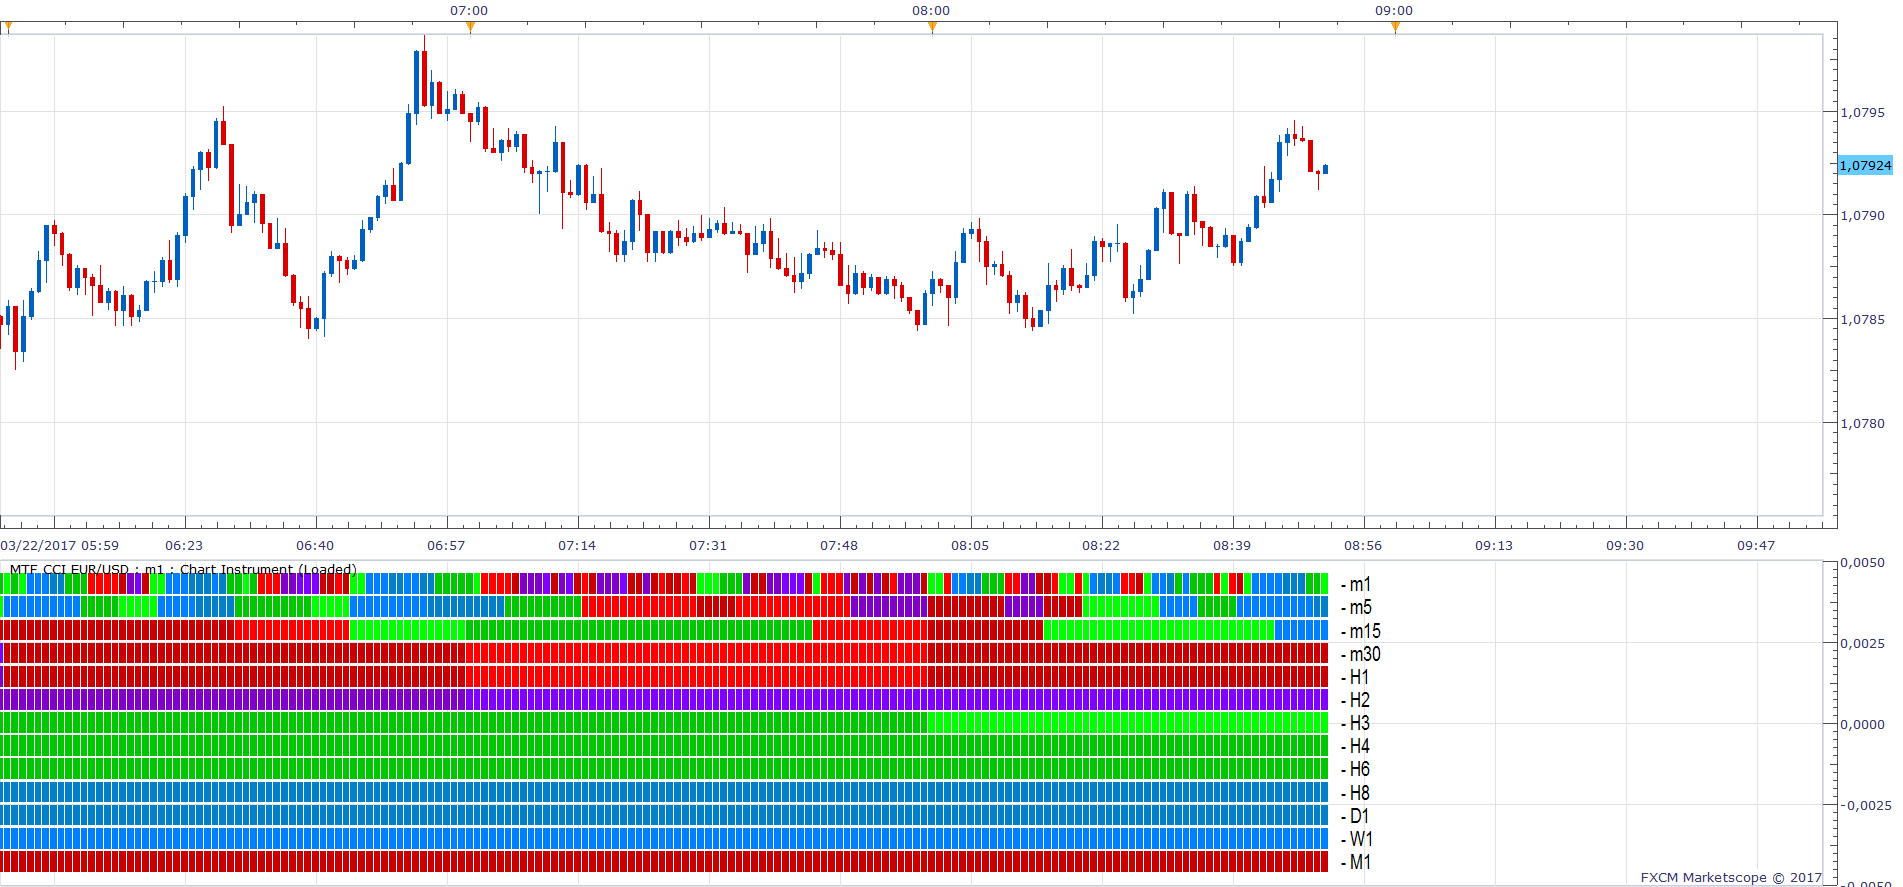
The indicator shows the relative position with respect to the zero line, Overbought / Oversold, growth or decline. The choice of colors, not a skill that I have. Suggestions are welcome. Please, in RGB format.
Re: Multitimeframe (MTF CCI)
taypot · Fri Nov 11, 2011 7:40 am
I am using this indicator quite successfully. I have changed the colours to read from pale pink, to dark pink to red for a falling price and pale blue to medium blue to dark blue for a rising. Rising in the oversold area is coloured white and my possible signal to buy (depending on where it is in other time frames) and falling in the overbought area is coloured black and my signal to sell (depending on where it is in other time frames).
I worked on this a couple of days ago and have not lost a trade yet but I take just a few pips.
My only issue is that the timeframe figures at the right end of the indicator are too close to the colours. Can they be moved a fraction further right?
Thank you for your hard work.
Re: Multitimeframe (MTF CCI)
virgilio · Tue Nov 15, 2011 10:30 am
Is it possible to create a strategy from this indicator? For example, buy when all 5 time frames are green (or positive) and sell when all 5 time frames are red (or negative)? Thank you.
Re: Multitimeframe (MTF CCI)
Apprentice · Tue Nov 15, 2011 5:34 pm
Your request is added to the development queue.
Re: Multitimeframe (MTF CCI)
Apprentice · Wed Nov 16, 2011 7:05 am
Requested can be found here. viewtopic.php?f=31&t=8136
Re: Multitimeframe CCI
Apprentice · Mon Mar 05, 2018 1:49 pm
The Indicator was revised and updated.