fxcodebase-backup
Multitimeframe Multisymbol RSI Map
Source: https://fxcodebase.com/code/viewtopic.php?f=17&t=2972
Forum: 17 · Topic 2972 · 3 post(s)
Multitimeframe Multisymbol RSI Map
Alexander.Gettinger · Wed Dec 15, 2010 11:54 pm
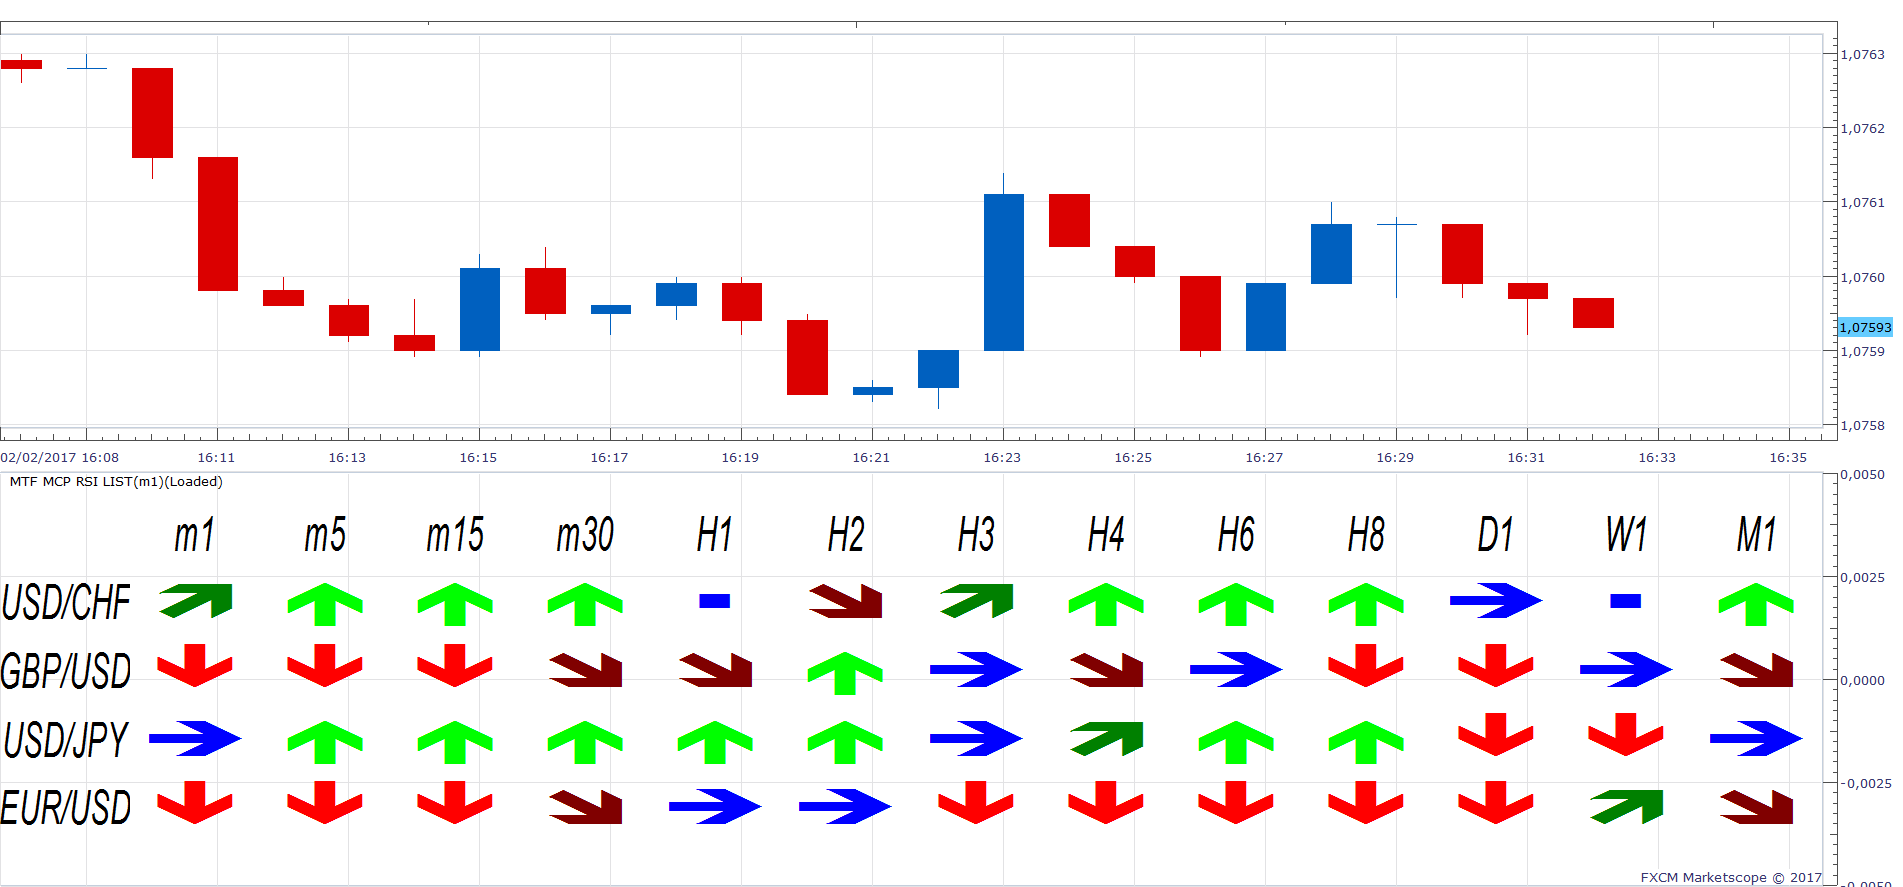
Indicator calculate RSI values for several instruments and several timeframes and compares last value RSI and (last-[RSI_Step]) value. Diff=RSI(last)-RSI(last-[RSI_Step]. If Diff<[Difference] and Diff>-[Difference] then indicator have a neutral signal, if Diff>[Difference] and Diff<[SDifference] then indicator have a UP signal, if Diff>[SDifference] then indicator have a Strong UP signal. Also for DOWN signals.
Download:
Re: Multitimeframe Multisymbol RSI Map
Ancient · Thu Dec 16, 2010 1:53 am
Hi Alexander,
Seems the Indicator is not refreshing.
Test 1: Viewing the Same Symbol on 4 different Time Frames with the exact same Indicator settings, the arrows are pointing in different directions on each of the four open charts.
Test 2: Viewing the Same Symbol on 4 Chart Windows on the Same Time Frame with the exact same Indicator settings, the arrows are pointing in different directions on each of the four open chart windows.
Regards Ancient
Re: Multitimeframe Multisymbol RSI Map
Apprentice · Mon Feb 05, 2018 9:23 am
The Indicator was revised and updated.