fxcodebase-backup
Normalized Moving Average Offset
Source: https://fxcodebase.com/code/viewtopic.php?f=17&t=68826
Forum: 17 · Topic 68826 · 1 post(s)
Normalized Moving Average Offset
Apprentice · Wed Aug 21, 2019 8:48 am
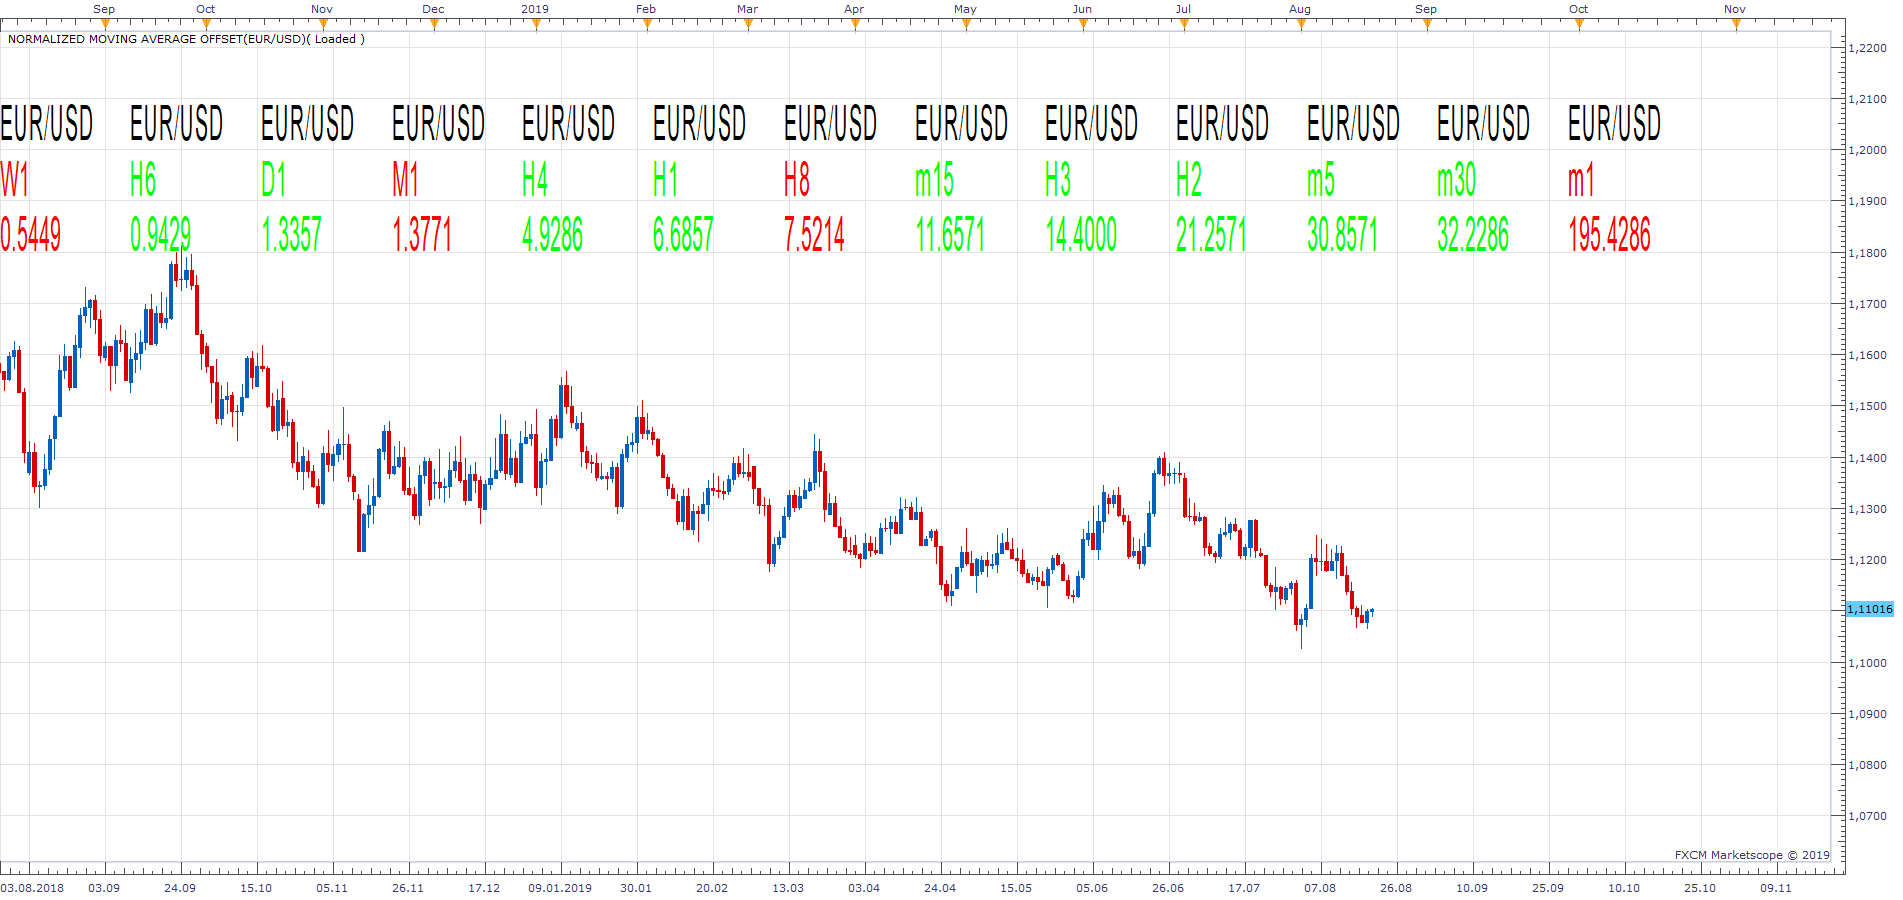
The dashboard will compare the current moving average slope (in pips) on different time frames as a measure of volatility. The dashboard will normalize data to the user-specified time frame. In the example. The most volatile is the “m1” time frame The least volatile is the “W1” time frame Data is normalized to the “D1” time frame.
An “m1” reading of 195.4284 will suggest, based on the current “m1” slope, if the current “m1” slopes continue, in the next 1440 minutes (one day), MA will move for 195.4284 pips.