fxcodebase-backup
Open Interest Approximation
Source: https://fxcodebase.com/code/viewtopic.php?f=17&t=33316
Forum: 17 · Topic 33316 · 4 post(s)
Open Interest Approximation
Apprentice · Thu Mar 14, 2013 7:49 am
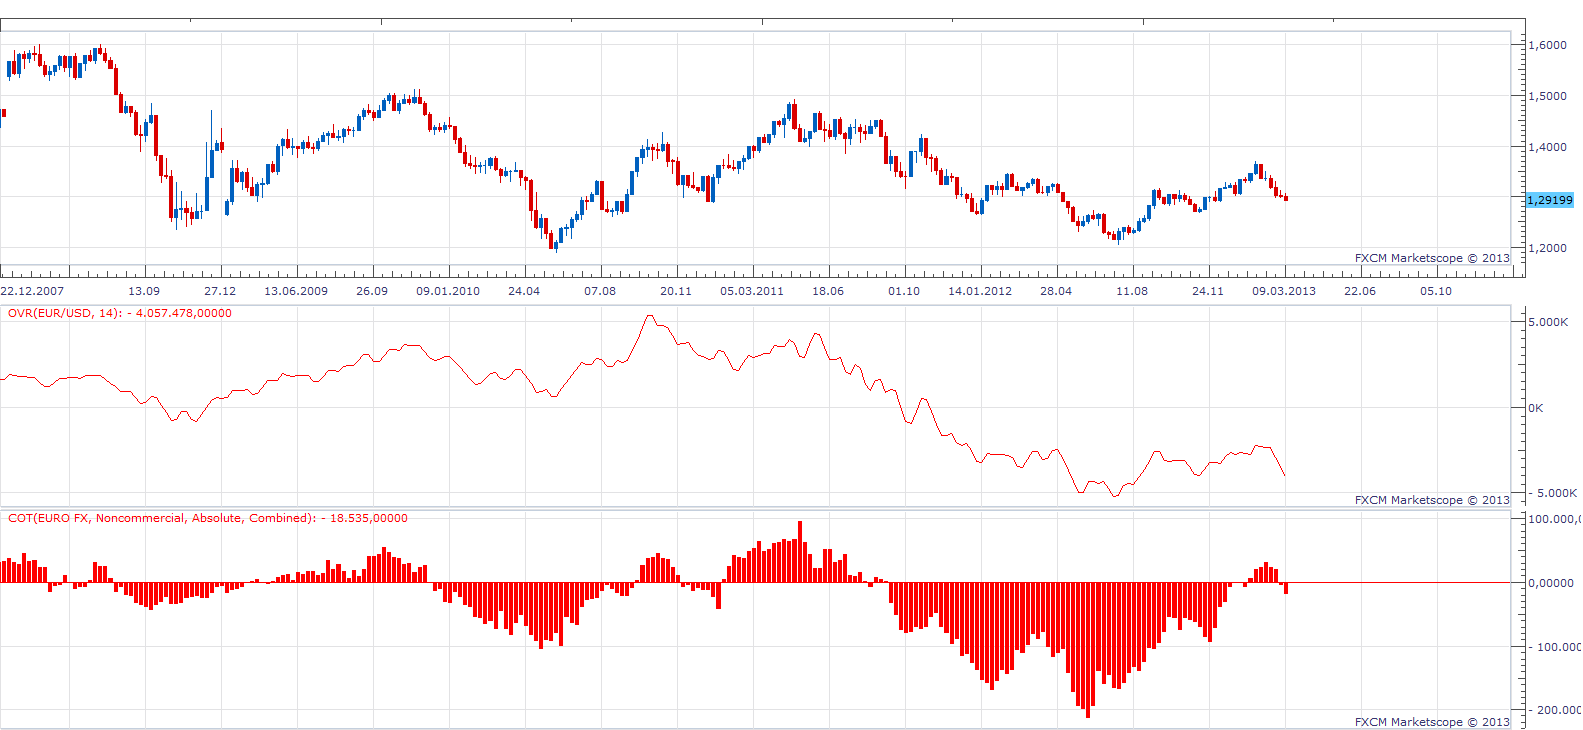
As shown by a comparative chart Open Interest Approximation, and COT, have a high degree of correlation. U can use Open Interest Approximation for istruments in cases where Open Interest or and COT are unavailable.
Re: Open Interest Approximation
nsaale · Mon Apr 01, 2013 5:07 am
how does this indicator work? should one buy when it is increasing and sell when it i s decreasing?
Again do negative and positive values indicate regions?
Re: Open Interest Approximation
Apprentice · Tue Apr 02, 2013 6:36 am
Open Interest, COT will give you information about the current positions, Long /Short Ratio, for observed Traders/investors. A positive/negativ value, the change in slope can provide a trade signal. This type of indicators will not have classical Overbought / Oversold zones.
Positive Long positions prevail. Negative Short positions prevail.
Changes are gradual, slope alone can give early indication.
You can interpret the ratio as Tide, and Slope as Wave.
Re: Open Interest Approximation
Apprentice · Wed May 10, 2017 5:31 am
Indicator was revised and updated.