fxcodebase-backup
Periodic Tool
Source: https://fxcodebase.com/code/viewtopic.php?f=17&t=61301
Forum: 17 · Topic 61301 · 10 post(s)
Periodic Tool
Apprentice · Sun Oct 05, 2014 11:37 am
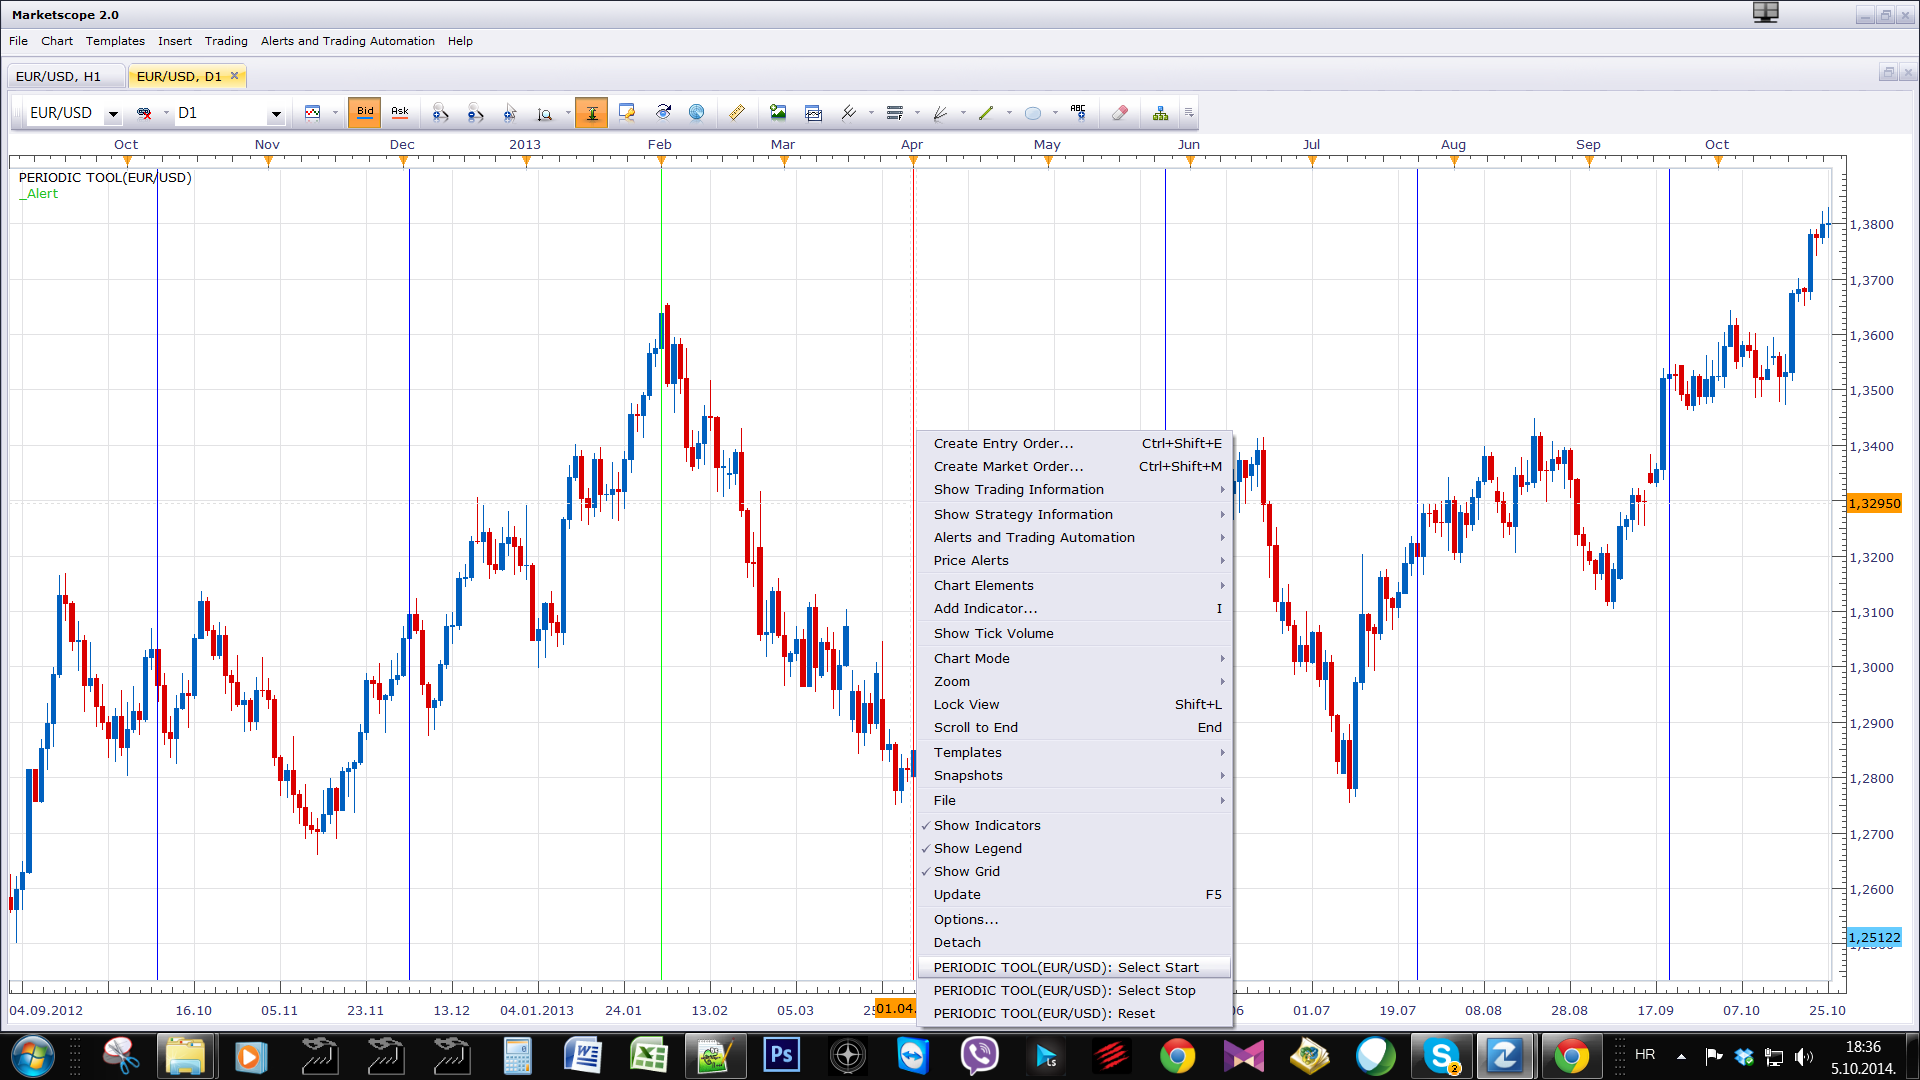
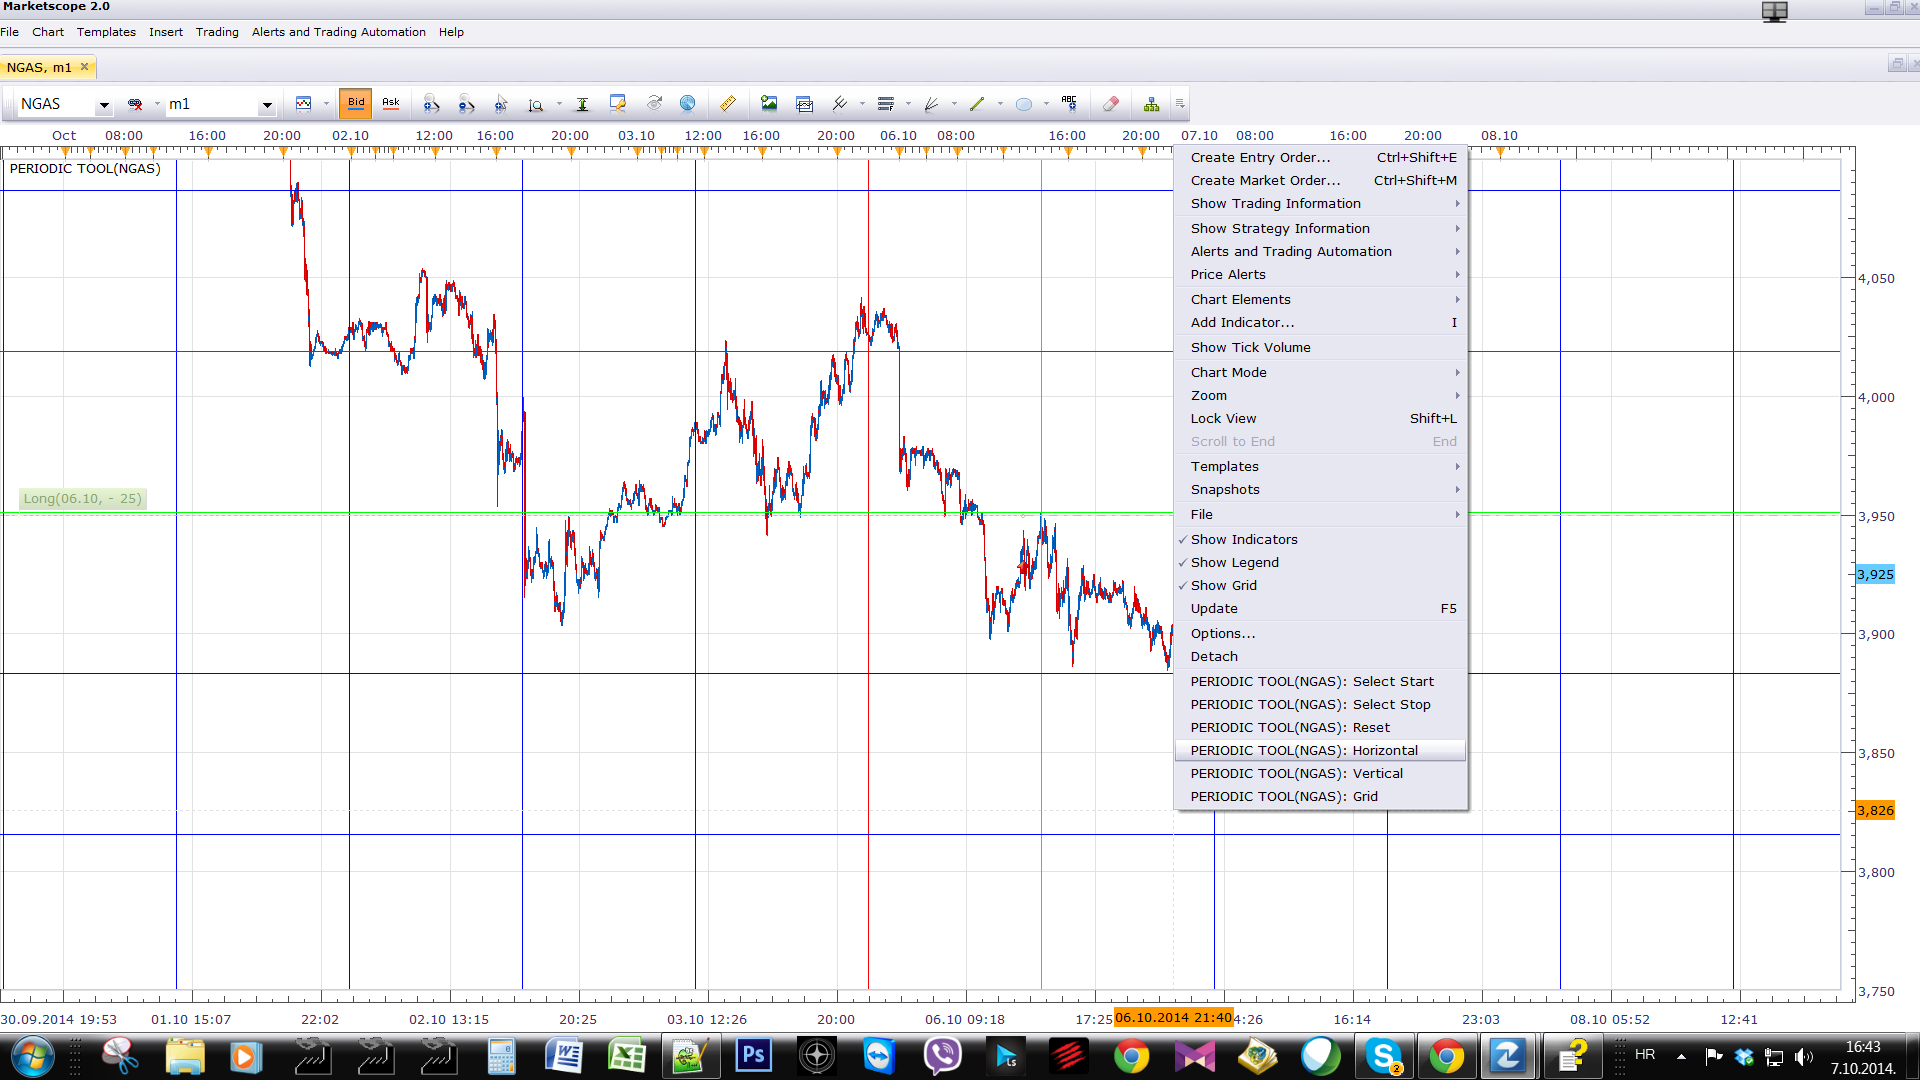
Price action can sometimes have periodically repeating pattern. This tool will draw a vertical line. The distance between two adjacent lines is defined by the Start / Stop line.
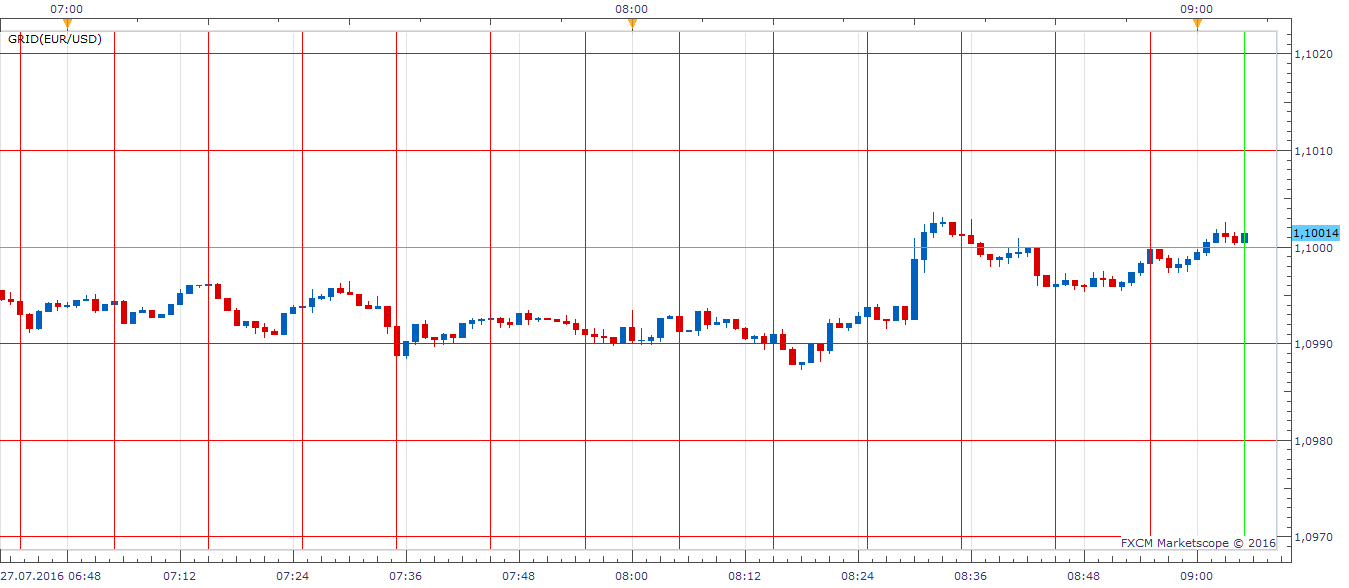
Grid, allows manual input.
The indicator was revised and updated
Re: Periodic Tool
volnmar · Mon Oct 06, 2014 2:38 pm
can you do this for horizontal lines too?
Re: Periodic Tool
Apprentice · Tue Oct 07, 2014 9:41 am
“Horizontal, “Vertical & “Grid” Option Added.
Re: Periodic Tool
volnmar · Wed Oct 08, 2014 7:00 am
god job thanks
Re: Periodic Tool
Apprentice · Sun Dec 07, 2014 5:12 am
Update
Re: Periodic Tool
Apprentice · Wed Jul 27, 2016 8:53 am
Grid.lua added.
Re: Periodic Tool
Hailkayy · Wed Jul 27, 2016 12:05 pm
That’s lit apprentice.
You got the core aspect of my query with the cursor to be able to select the date. That’s next level. Thanks.
On the final tweakings, I got plenty of stuff on chart so can you make thickness and lines style option please ?
Dope ! Thanks.
Re: Periodic Tool
Apprentice · Thu Jul 28, 2016 5:43 am
Try it now.
Re: Periodic Tool
Hailkayy · Wed Aug 03, 2016 12:01 am
Thanks !
Re: Periodic Tool
Apprentice · Fri May 05, 2017 4:46 pm
Indicator was revised and updated.