fxcodebase-backup
Prevailing Trend
Source: https://fxcodebase.com/code/viewtopic.php?f=17&t=59402
Forum: 17 · Topic 59402 · 31 post(s)
Prevailing Trend
Apprentice · Thu Sep 05, 2013 1:49 pm
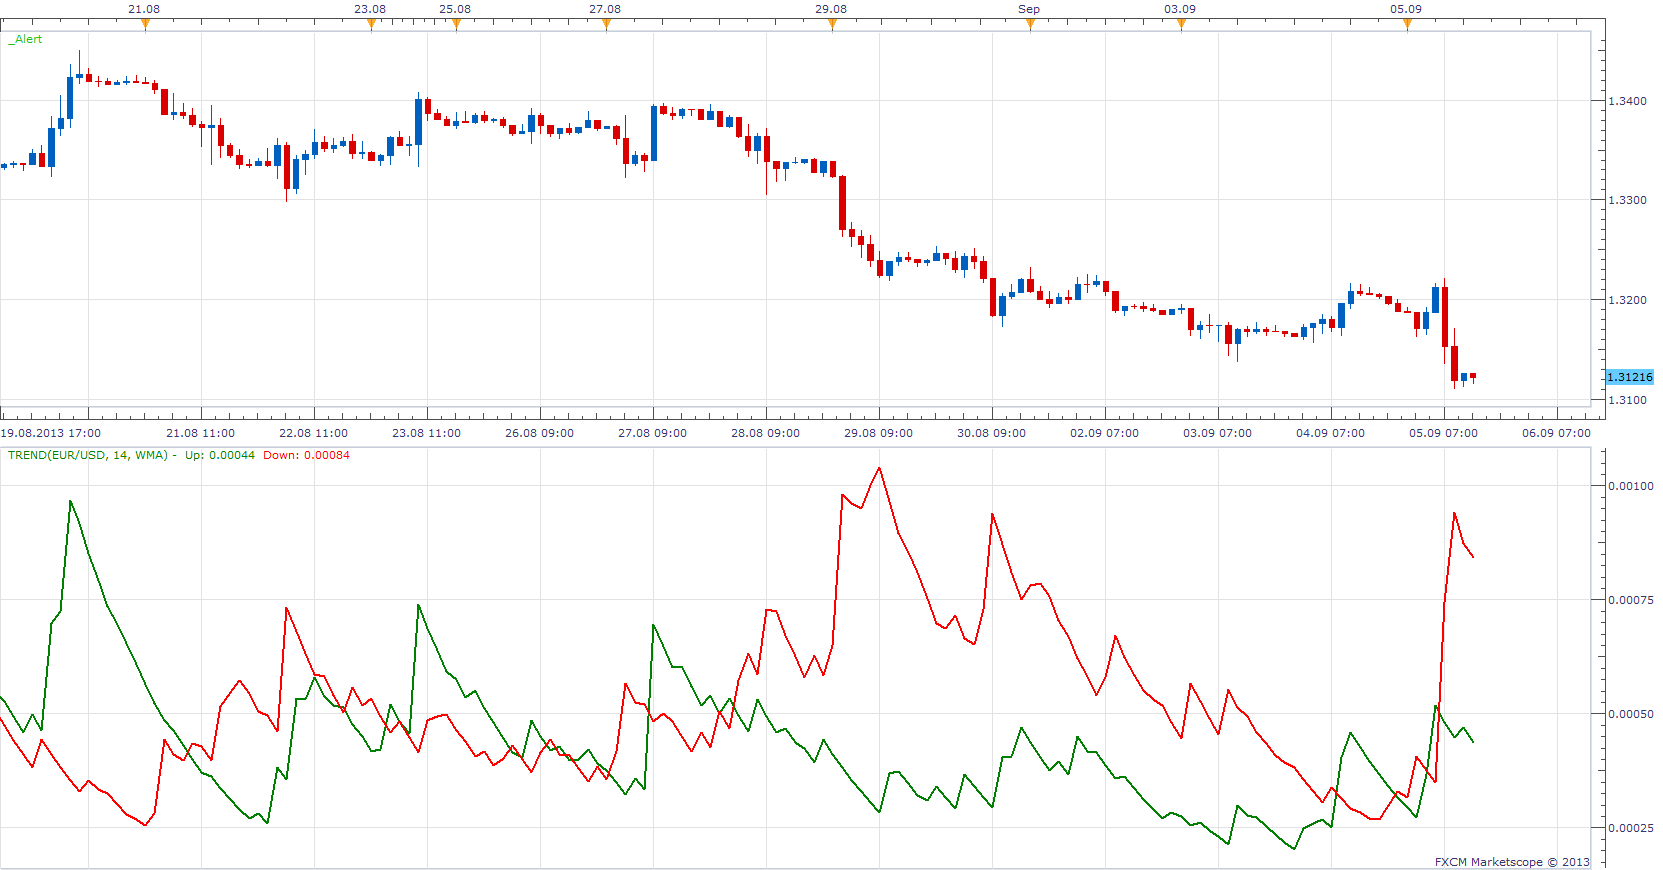
Up moving average of UP candles for n periods
Down moving average of DOWN candles for n periods
Re: Prevailing Trend
speakinmymind · Thu Sep 05, 2013 3:11 pm
To verify, these are the moving averages of the SIZE of up/down candles and do not use price in the equation?
Also, with the same formula, can you create this MVA of all candles? Basically, the same formula without the split.
Thanks alot!
Apprentice wrote:
Trend.png
Up moving average of UP candles for n periods
Down moving average of DOWN candles for n periods
Trend.lua
Re: Prevailing Trend
Apprentice · Fri Sep 06, 2013 3:38 am
- Candle Size is used.
- Use greater period.
Re: Prevailing Trend
speakinmymind · Sat Sep 07, 2013 4:11 pm
Great!
Can you please create a strategy that executes upon cross.
Thanks alot!!
Re: Prevailing Trend
Apprentice · Sun Sep 08, 2013 1:28 am
Your request is added to the development list.
Re: Prevailing Trend
Apprentice · Sun Sep 08, 2013 5:07 am
Requested can be found here. viewtopic.php?f=31&t=59426&p=89256#p89256
Re: Prevailing Trend
Alexander.Gettinger · Mon Sep 30, 2013 10:05 am
MQL4 version of Prevailing Trend oscillator: viewtopic.php?f=38&t=59601.
Re: Prevailing Trend
evgeniyn · Tue Oct 01, 2013 1:40 pm
Hi, What difference with
Drive
http://fxcodebase.com/code/viewtopic.php?f=17&t=54880&p=89013&hilit=drive#p89013 The Drive has same algoritm,
Re: Prevailing Trend
speakinmymind · Wed Oct 23, 2013 9:07 am
Could you please add the same difference output as you updated in the split moving average indicator? Thanks!
viewtopic.php?f=17&t=59276&start=10
Re: Prevailing Trend
Apprentice · Thu Oct 24, 2013 1:28 am
Show difference option added.
Re: Prevailing Trend
speakinmymind · Fri Nov 08, 2013 12:49 am
Could you please add the option to turn off each components?
Cutting off the data stream instead of choosing “no line” is what I am looking for. This should help with display purposes.
Thanks
Re: Prevailing Trend
Apprentice · Fri Nov 08, 2013 4:22 am
Try updated version.
Re: Prevailing Trend
speakinmymind · Mon Nov 11, 2013 1:19 am
Could you please create a strategy that uses the difference line. Buy / Sell is at the cross of the zero line. Buy once it crosses into positive territory, sell when it crosses negative.
Thanks!
Re: Prevailing Trend
Apprentice · Mon Nov 11, 2013 4:44 am
I have to say no. If you look carefully, you’ll notice that the Up / Down Cross coexistence along Histogram / Zero Line crosses. Similar to viewtopic.php?f=31&t=59426&p=89256#p89256
Re: Prevailing Trend
speakinmymind · Mon Nov 11, 2013 9:50 am
Apprentice wrote: I have to say no. If you look carefully, you’ll notice that the Up / Down Cross coexistence along Histogram / Zero Line crosses. Similar to viewtopic.php?f=31&t=59426&p=89256#p89256
I do not understand, could you explain it a litte better? If a strategy can’t be created, could an alert be created once the difference line crosses zero line?
Re: Prevailing Trend
speakinmymind · Mon Dec 30, 2013 10:05 pm
could you please add two more decimal places to the data output? thank you
Re: Prevailing Trend
Apprentice · Tue Dec 31, 2013 5:04 am
An additional two added.
Re: Prevailing Trend
speakinmymind · Fri Jan 03, 2014 5:08 pm
I assume that this uses the high and low to determine candle size. Can you make it optional to make it the open and close that determine candle size instead? Thanks
Re: Prevailing Trend
Apprentice · Sun Jan 05, 2014 7:25 am
I have trouble finding your original request. Can you help.
In fact old version uses the open / close.
Newly introduced Tick Trend.lua uses close and previous close, Applicable to Non Candle data sources.
Trend.lua is also updated. I have add H/L and O/C selector.
Re: Prevailing Trend
speakinmymind · Sun Jan 05, 2014 3:10 pm
Apprentice wrote: I have trouble finding your original request. Can you help.
My original request can be found here: viewtopic.php?f=27&t=59401
Thanks for the clarification and update.
Re: Prevailing Trend
speakinmymind · Thu Jan 30, 2014 11:22 am
I was wondering if the difference of this indicator can some how be imposed on the price chart.
Maybe using a formula it can be done. I was thinking multiplying the output of the difference by 100 or so, and adding (subtracting for negative) that number of pips to the current price to plot the line.
Does this seem feasible?
Re: Prevailing Trend
Apprentice · Sat Feb 01, 2014 2:42 pm
Maybe we can use some method of normalization.
Re: Prevailing Trend
Apprentice · Sun Feb 02, 2014 4:25 am
Something like this.
Without clear guidance, I am not willing to continue this task.
Re: Prevailing Trend
speakinmymind · Sun Feb 02, 2014 11:42 am
I apologize if i seemed unresponsive.
The indicator with normalization is a very helpful tool!!
I was envisioning something different though. Based on the difference line (DL) output data only, I was hoping a line can be created.
The formula would be something like this for the line on the chart:
1) When ever the DL equals zero, that should plot a point on the Close/Open price.
2) When ever the DL is above zero, (say .00035) this number can be represented as a percentage increase from zero. (say and increase of .025%)
3) That percentage can be added to the Close/Open price to plot that point.
4) Step 2 and 3 used for negative output as well.
The resulting line should in theory basically show convergence/divergence between the line and what price is doing.
I hope that wasn’t too confusing!! Thanks!
Re: Prevailing Trend
speakinmymind · Mon Feb 03, 2014 1:48 am
I just realized the normalization shows what I want except the difference line.
Could you just replace the difference line option with a line that is the mid point between the up and down line.
Thanks!!
Re: Prevailing Trend
Apprentice · Mon Feb 03, 2014 5:57 am
Try Updated Version.
Re: Prevailing Trend
speakinmymind · Mon Feb 03, 2014 10:48 am
Great! Thanks!!
Could you please create a strategy that buys on cross up and sells on cross down of trend norm diff line?
Thanks!
Re: Prevailing Trend
speakinmymind · Mon Feb 03, 2014 12:59 pm
Hey this is a great tool!!
Could you please explain the normalization formula or give me a link on the topic to further understand what you did?
Re: Prevailing Trend
Apprentice · Tue Feb 04, 2014 3:15 am
This formula was used.
min1,max1=minmax(close,NormalizationPeriod);
min2,max2=minmax(UPNormalizationPeriod);

Up=  ((UP - min2)/ (max2-min2))*(max1-min1) +min1  ;
Down=  ((DOWN- min2)/ (max2-min2))*(max1-min1) +min1  ;
Re: Prevailing Trend
Apprentice · Sat Aug 19, 2017 3:59 pm
The indicator was revised and updated.
Re: Prevailing Trend
Apprentice · Wed Sep 12, 2018 6:02 am
The Indicator was revised and updated.