fxcodebase-backup
Previous Days High Low
Source: https://fxcodebase.com/code/viewtopic.php?f=17&t=62859
Forum: 17 · Topic 62859 · 7 post(s)
Previous Days High Low
Apprentice · Fri Nov 06, 2015 5:22 am
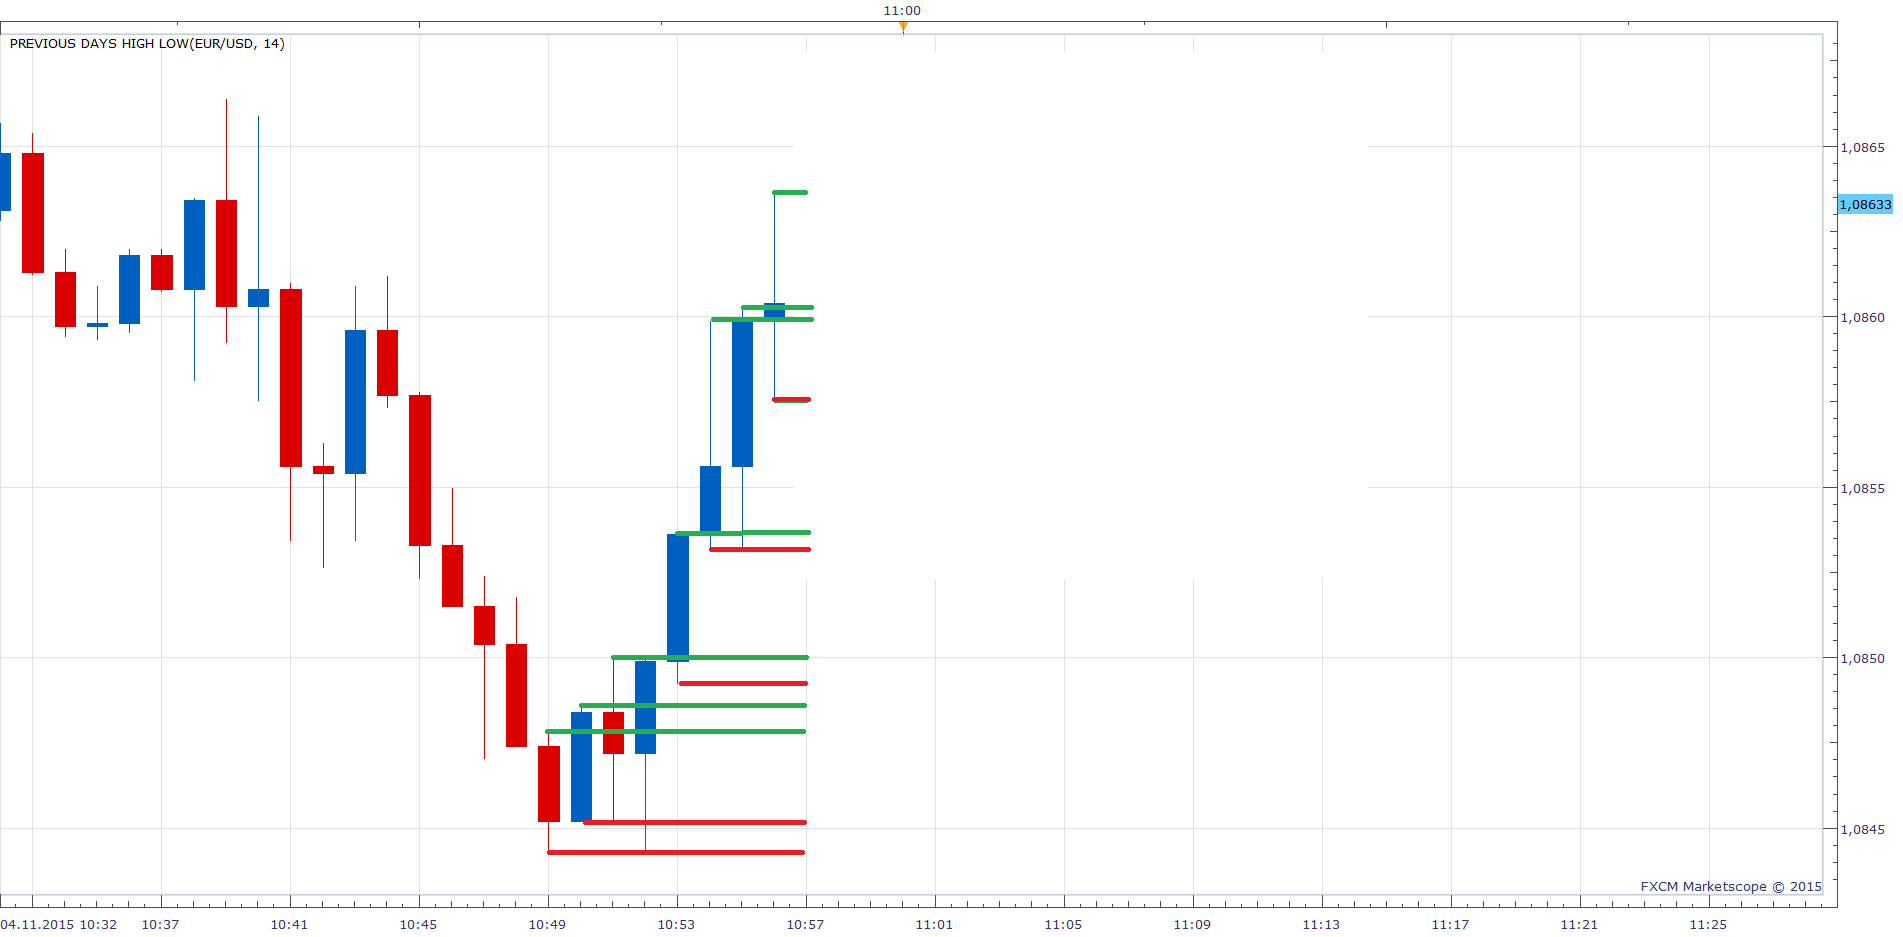
This indicator should provide line for each high / low of last N candle.
Due to draw line TS bug, I use draw a rectangle as a workaround. Some functionality may be impaired.
Re: Previous Days High Low
davidnwatson · Wed Dec 02, 2015 3:08 pm
Can you make a strategy for this?
on Last candle or period set
At last candle high create a entry limit Buy order. At last candle low create a entry limit Sell order.
Remove any entry orders not activated in past # of candles
Send an email if limit order is activated by price
Parameters Allow to trade Amount of lots to trade set limit order Limit Order in pips Set stop orders stop order in pips Trailing stop order
Show alerts play sound sound file recurrent sound send email email address
Re: Previous Days High Low
Apprentice · Thu Dec 03, 2015 6:13 am
Your request is added to the development list.
Re: Previous Days High Low
davidnwatson · Tue Mar 29, 2016 11:37 pm
Any update on the Strategy? it would be a nice thing to have.
Re: Previous Days High Low
Atmotrader · Fri Apr 01, 2016 6:14 pm
Hello,
a version where the highs and lows of the daily chart would be visible in the lower time frames would be nice.
Re: Previous Days High Low
Apprentice · Tue Apr 05, 2016 5:50 am
Something like this? viewtopic.php?f=17&t=20388&p=93525&hilit=day+high#p93525 You will find similar implementations on the forum also.
Re: Previous Days High Low
Apprentice · Wed Aug 15, 2018 6:55 am
The indicator was revised and updated.