fxcodebase-backup
Price Overlay
Source: https://fxcodebase.com/code/viewtopic.php?f=17&t=2324
Forum: 17 · Topic 2324 · 32 post(s)
Price Overlay
Apprentice · Sat Oct 02, 2010 3:39 pm
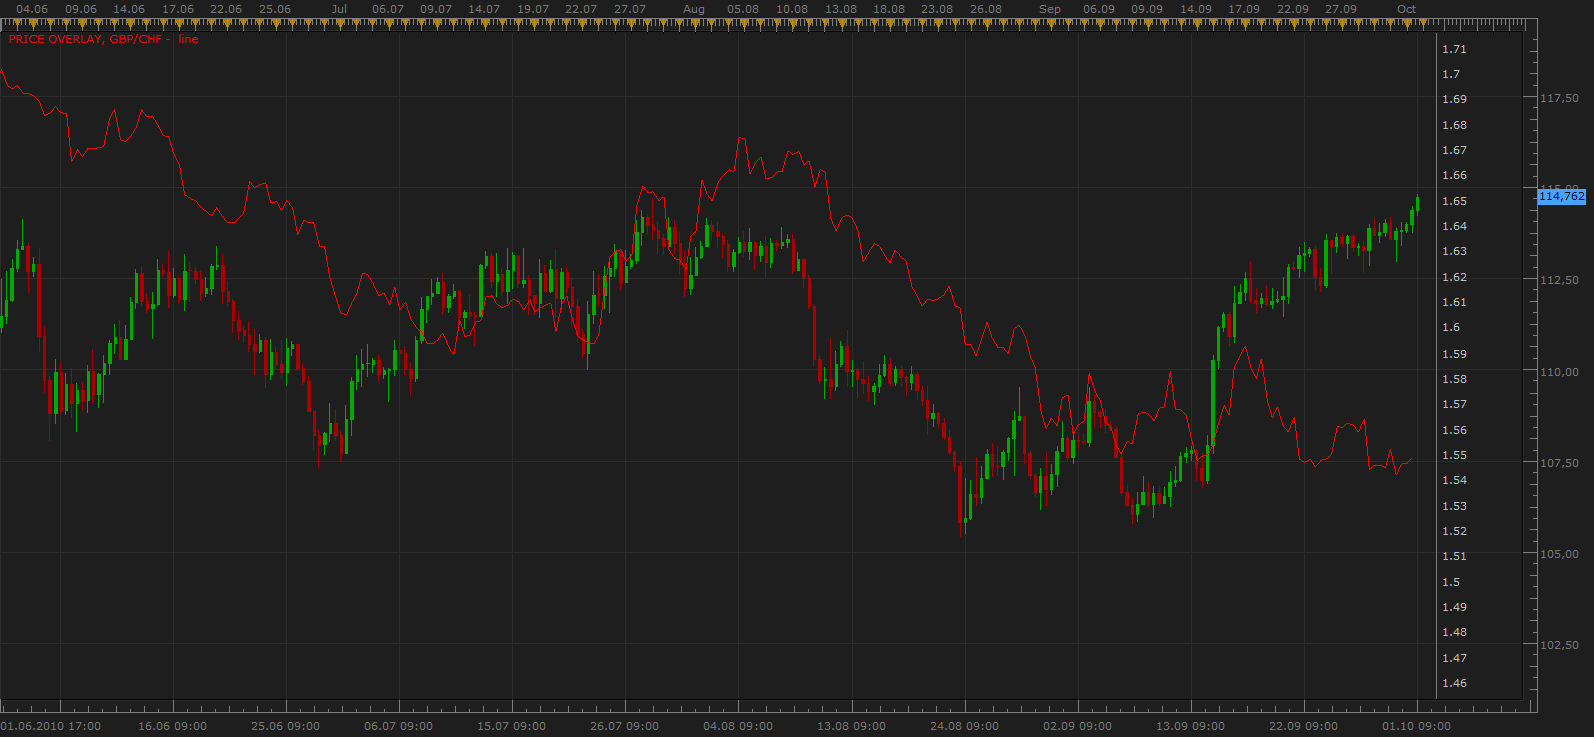
Allows you to pick One overlaying currency pair. Supports, Price Scaling, Japanese Candlesticks, Inverse currency pairs.
I wrote it during the weekend, so It is not tested on Live Market
MT4/MQ4 version viewtopic.php?f=38&t=68378
Re: Price Overlay
webcom · Sun Oct 03, 2010 12:07 pm
Thank you very much!I`ll test it on live market tomorrow!
Webcom
Re: Price Overlay
webcom · Thu Oct 07, 2010 3:27 am
Hi Apprentice,
I tested the Indicator and it works well,the mirror function is there and it makes a difference… What I think that can be inproved, to fully play its role is to have the same scale on the indicator as on the chart.Only in this way one can compare and confidently visualise Price Action in the two graphs.Otherwise we can make a” pretty good idea” of the PA but not sufficient.In the attached charts 12 “cm” on the initial chart are 1500 pips while on indicator 1100 pips.
Is it possible to modify the indicator so : 1”cm”[Indicator-scale]=1”cm”[Marketscope-scale]=X[Pips]? Thank you for your understanding!
Re: Price Overlay
Apprentice · Thu Oct 07, 2010 4:21 am
This is intentional. Axes are the same, for same not inverse currency pairs.
I can add an option to turn off this feature.
The problem occurs if on the chart you added, two currency pairs that are significantly different, EUR / USD and 1.396 for example USD / JPY 82.52
For this reason, I normalized charts, relatively. But if i think I will surely find a way of absolute normalization.
Re: Price Overlay
webcom · Thu Oct 07, 2010 12:04 pm
Thank you for your prompt answer!
Unfortunatelly the indicators scale is different from the charts scale even when the graph is not inversed….(see attachment chart).I must agree that eyeballing the chart,it seems to be a credible and very Ok representation of the negative correlation between EURUSD and USDCHF.But this is not our purpose.What the chart is showing is that both pairs have the same quantity of Price Action/virtual “cm” (see the two equal segments that we suppose for simplicity to be parts of the two graphs).In reality the 2 PA are 100 respectivelly 140 pips.Thus the two graphs cannot be compared properly.Sure, one can do the math and find out the ratio but the point is to have an accurate visual representation of the correlation be it positive or negative.Our purpose simply put is:
1)chart A overlayied on chart B. 2)Same amount of pips per virtual “cm” on both charts.
Sorry for my conference- like replay but if we(you:))manage to create such an indicator och in perspective to have it in the “Overlay chart…” option of Marketscope it would be of great importance for all traders that use PA combined with Correlation trading.Think that with an accurate mirror function there would not be such a thing as “negative correlation” on the charts!
Its not an easy task to create an indicator to fullfil the grade of accuracy and perfect match with the chart, but I think that its worth the effort and the reward in well monitored pips!And its no hurry for such a mission, only if you can put a time perspective it would be great!
Last but not least I want to congratulate you and your colleagues for your efforts and the understanding of traders needs!
Friendly Webcom
Re: Price Overlay
webcom · Tue Oct 12, 2010 7:47 am
Hi
Is this indicator, with the improvements described above, possible to develope? If so, can anyone develope it in the near future?
Thank you! webcom
Re: Price Overlay
lisa_baby_xx · Sat Jul 16, 2011 9:41 am
Hi Apprentice,
This is an excellent indicator.
Can I request Multiple Currency/Commodity parameters, so that if I wanted to monitor the following: GBP/USD, EUR/USD, EUR/GBP etc.. than I can do from the main chart. Line type/style/colour would also be nice.
Many thanks and much love. XX. lisa_baby_xx
Re: Price Overlay
Apprentice · Sun Jul 17, 2011 3:57 am
Style Option Added.
Re: Price Overlay
lisa_baby_xx · Sun Jul 17, 2011 4:14 am
Hi Apprentice,
Thanks sweetie! X-X
I have just realised that I can use multiple instances of this indicator and select which currency I would like to overlay! I was previously using the in-built price overlay that comes with MS.
Thanks again sweetie. lisa_baby_xx
Re: Price Overlay
lisa_baby_xx · Wed Jul 20, 2011 11:53 am
Hello Everyone!
I think this indicator is excellent. Can “Shift Horizontal” and “Shift Vertical” parameters be added to this indicator? I am looking for a displacement effect.
Much love to one and all and Happy Pipping! lisa_baby_xx
Re: Price Overlay
Apprentice · Wed Jul 20, 2011 1:42 pm
Your request is added to the developmental cue.
Re: Price Overlay
lisa_baby_xx · Wed Jul 20, 2011 1:50 pm
Many thanks sweetie. X-X-X-X-X-X.
Re: Price Overlay
luigipg · Tue Aug 21, 2012 9:40 am
hi, you can solve the question submitted by “WebCom” using as a scale not the price but the percentage between the currencies. For help visit http://www.netdania.com/Products/live-s … t.aspx?m=c I hope someone does it. Thanks. Luigi!!!
Re: Price Overlay
Apprentice · Fri Jun 13, 2014 5:29 am
Major Update of Price Overlay. Please Re-Download.
Re: Price Overlay
rtsayers · Sun Jun 21, 2015 3:50 pm
Hi Apprentice
Would it be possible to do something like this? http://www.sierrachart.com/supportboard … hp?t=38046
I have tried the inverted indicator but has no lines or ability to add indicators and no price line. I have also tried the Reverse Candle indicator but it doesn’t work?
Thanks
Re: Price Overlay
Apprentice · Mon Jun 22, 2015 2:36 am
Mirror Chart? Do you have any idea how it was calculated?
Reverse Candle is calculated as 1/Price
Re: Price Overlay
rtsayers · Tue Jun 23, 2015 1:30 am
Hi Apprentice
Sorry I don’t know I just posted on Reverse Charts and I tried the newly posted link you sent and I was unable to add indicators to the USdollar index chart but I wish I could tell you how they calculated this because this would be a awesome feature to flip the charts! Sorry!
Thanks
Re: Price Overlay
Apprentice · Tue Jun 23, 2015 3:27 am
It should work for indicator using tick data like MVA. Will not work for the indicator that require a whole bar like the ADX, HA …
Re: Price Overlay
rtsayers · Tue Jun 23, 2015 4:56 pm
Hi Apprentice
I think it calculated like this
Use either of these two studies: 1 Divided by Price Multiply Bars by - 1
Thanks
Re: Price Overlay
parisblue2 · Thu Nov 12, 2015 3:19 am
Does this indicator still work for everyone?
I added it today and no matter what currency I select it only shows an inverse line of the current chart price that it was added to.
E.g. if add it to a SP500 chart and select EURUSD the price overlay line is the SP500 but inverted.
Thanks.
Re: Price Overlay
Apprentice · Fri Nov 13, 2015 3:58 am
Please set Auto to NO.
Re: Price Overlay
parisblue2 · Fri Nov 13, 2015 4:56 am
Apprentice wrote: Please set Auto to NO.
Perfect! thanks!
Re: Price Overlay
Paul W · Wed Aug 24, 2016 2:18 pm
was hoping to find a better alternative to existing TSII indicator
downloaded, but appears to have compatibility issues with the latest version of Trading Station
could you have a look pls
Thanks
Re: Price Overlay
Apprentice · Fri Aug 26, 2016 3:30 am
Can you describe the problem that you experience, provide screenshot.
Re: Price Overlay
Paul W · Fri Aug 26, 2016 12:39 pm
indicator appears not to accept price overlay parameter - overlays/duplicates existing chart pair
not correctly displaying scale, when CFD overlay is selected ? - could an option be added to display on left side ?
am using current TSII version - I believe
thanks
Re: Price Overlay
Apprentice · Mon Aug 29, 2016 3:38 am
Do you want to use another currency, Set Auto, to NO.
If inverted is ON, chosen currency will be inverted . Inverted = 1 / Instrument.
Re: Price Overlay
Apprentice · Sun Jul 30, 2017 10:39 am
The indicator was revised and updated.
Re: Price Overlay
jusiur · Sun Apr 21, 2019 6:36 pm
Thank for valuable tool, may I ask if it is available for MT4?
Re: Price Overlay
Apprentice · Mon Apr 22, 2019 5:48 am
Your request is added to the development list under Id Number 4612
Re: Price Overlay
Apprentice · Tue Apr 23, 2019 7:00 am
MT4/MQ4 version viewtopic.php?f=38&t=68378
Re: Price Overlay
jusiur · Tue Apr 23, 2019 12:59 pm
Thank you very very much sr
Re: Price Overlay
Apprentice · Tue May 13, 2025 4:03 am
Updated.