fxcodebase-backup
Relative Volatility Index
Source: https://fxcodebase.com/code/viewtopic.php?f=17&t=33759
Forum: 17 · Topic 33759 · 3 post(s)
Relative Volatility Index
Apprentice · Sat Mar 23, 2013 2:00 pm
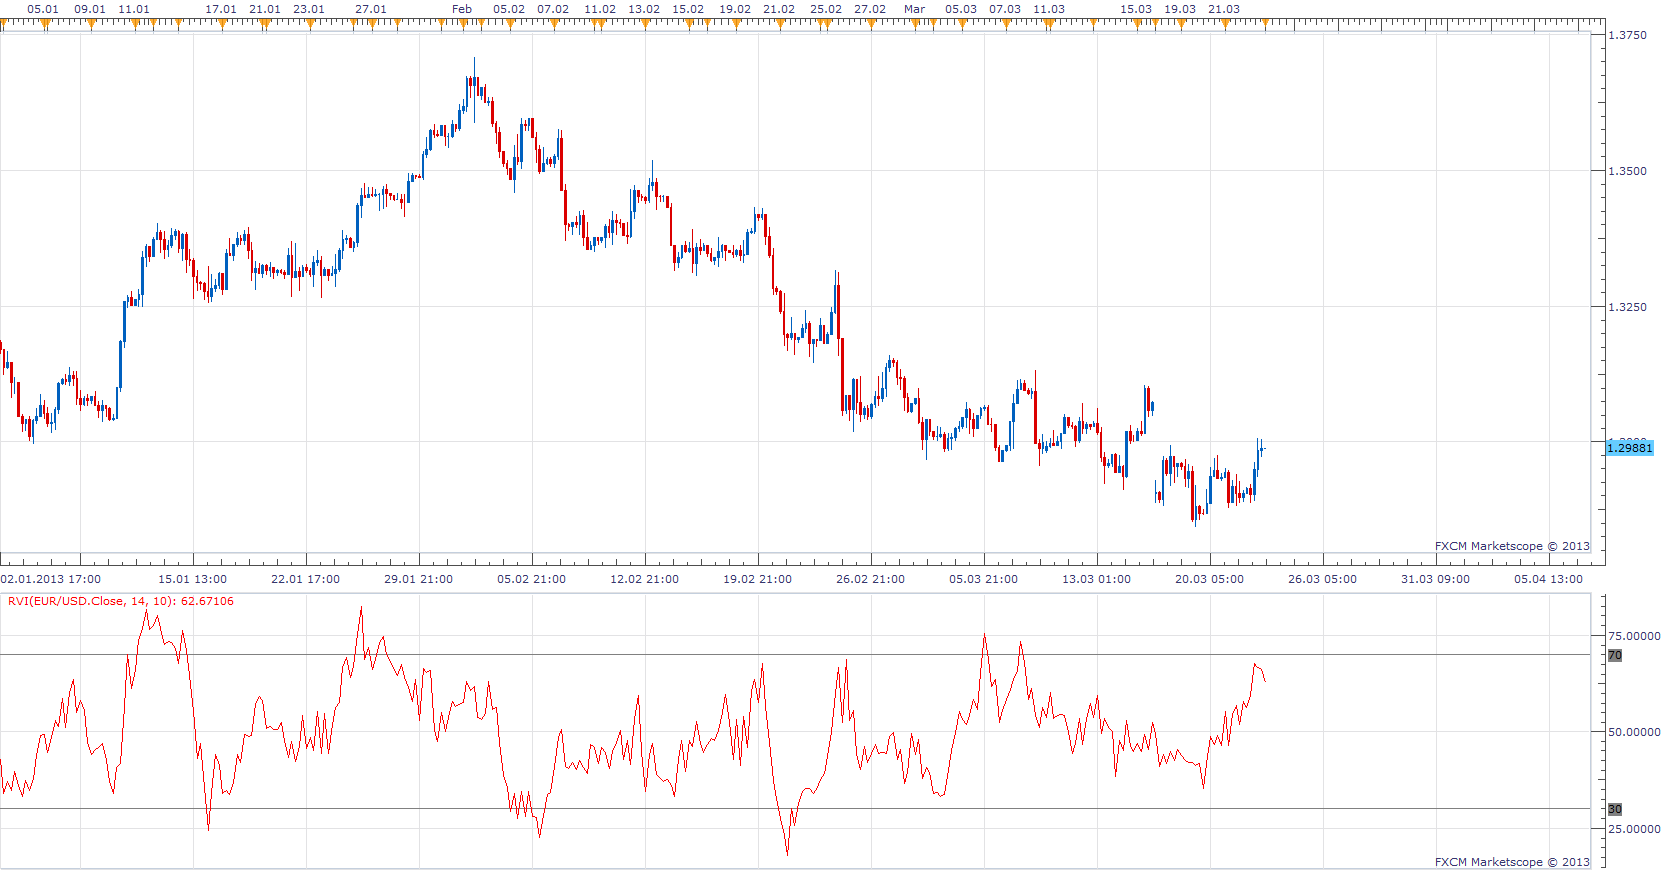
Relative Volatility Index was presented by Donald Dorsey in the June 1993 issue of Technical Analysis of Stocks and Commodities
Up Day U = STDEV else U =0; Down Day D = STDEV else D =0;
RVI = 100 * MA of U /( MA of U+ MA of D) Relative Volatility Index is similar to the Relative Strength Index (RSI), however it uses the standard deviation over the past 10 days rather than daily price change.
The indicator was revised and updated
Re: Relative Volatility Index
Apprentice · Tue Apr 02, 2013 11:45 am
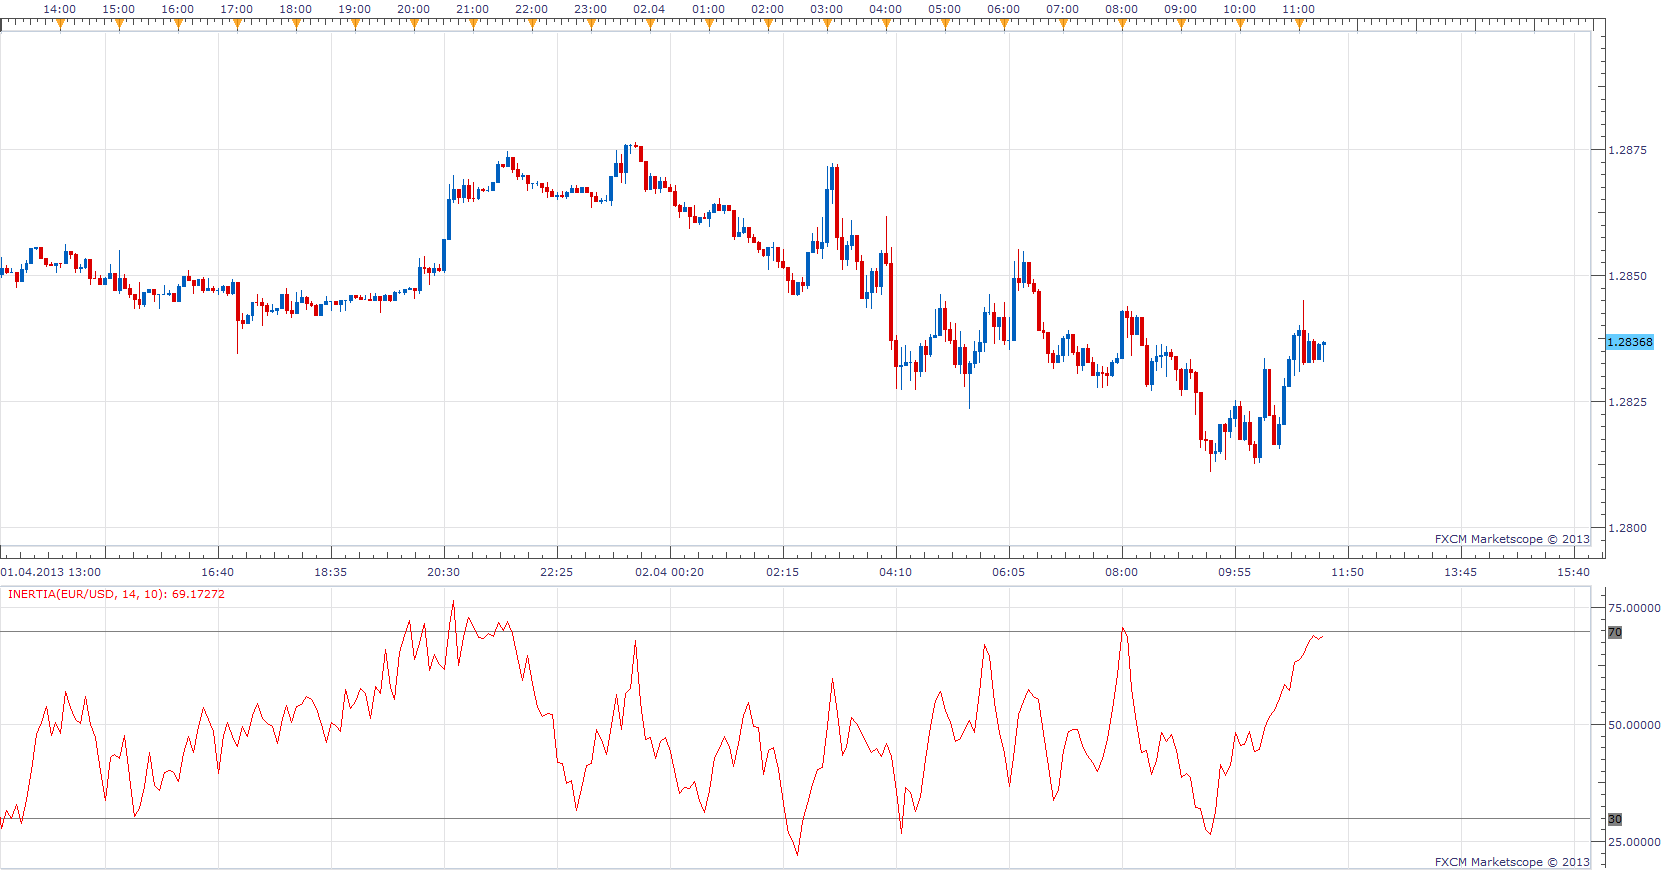
Inertia was presented by Donald Dorsey in september 1995 issue of S&C magazine. Inertia (RVI of High + RVI of Low ) /2 Positive Inertia Inertia> 50 Negative Inertia Inertia <50
Re: Relative Volatility Index
Apprentice · Wed May 10, 2017 5:28 am
Indicator was revised and updated.