fxcodebase-backup
RSI Bar
Source: https://fxcodebase.com/code/viewtopic.php?f=17&t=14385
Forum: 17 · Topic 14385 · 8 post(s)
RSI Bar
Apprentice · Wed Feb 29, 2012 3:03 pm
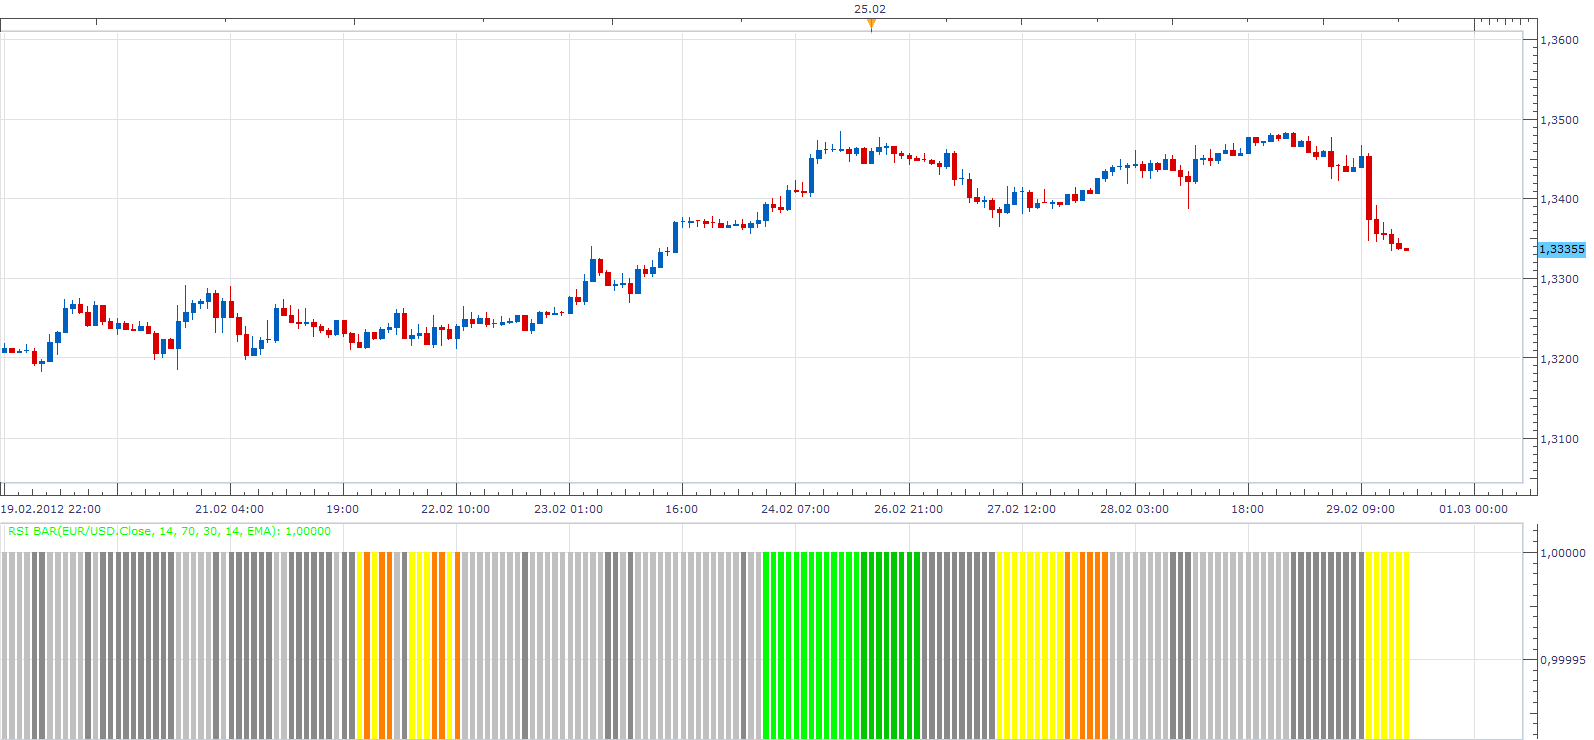
The indicator changes color depending on whether we are above or below the central line, in the overbought / oversold area. We use smoothed data , if you use 1 as smoothing period, You’ll have your regular RSI indicator, indication.
The indicator was revised and updated
Re: RSI Bar
Avignon · Mon Nov 17, 2014 4:09 am
Hello,
It does not display well with indices.
Re: RSI Bar
Apprentice · Mon Nov 17, 2014 5:22 am
This is a consequence of the known undesirable TS behavior. Try this updated version. I have use a different approach that will eliminate this problem.
Re: RSI Bar
Avignon · Mon Nov 17, 2014 5:15 pm
Great ! And thank you for all the work you’re doing.
Re: RSI Bar
Alexander.Gettinger · Tue Nov 18, 2014 5:16 pm
MQL4 version of RSI Bar: viewtopic.php?f=38&t=61479.
Re: RSI Bar
Avignon · Wed Feb 04, 2015 4:11 pm
Hello,
Sometimes it crashes. I get this message (in french) :
Trace : ‘RSI Bar.lua:168: the index is out of range’
Re: RSI Bar
Apprentice · Thu Feb 05, 2015 3:06 am
Fixed.
Re: RSI Bar
Apprentice · Sun Jul 02, 2017 12:35 pm
The indicator was revised and updated.