fxcodebase-backup
RSI Candle
Source: https://fxcodebase.com/code/viewtopic.php?f=17&t=1927
Forum: 17 · Topic 1927 · 21 post(s)
RSI Candle
Apprentice · Wed Aug 25, 2010 4:42 am
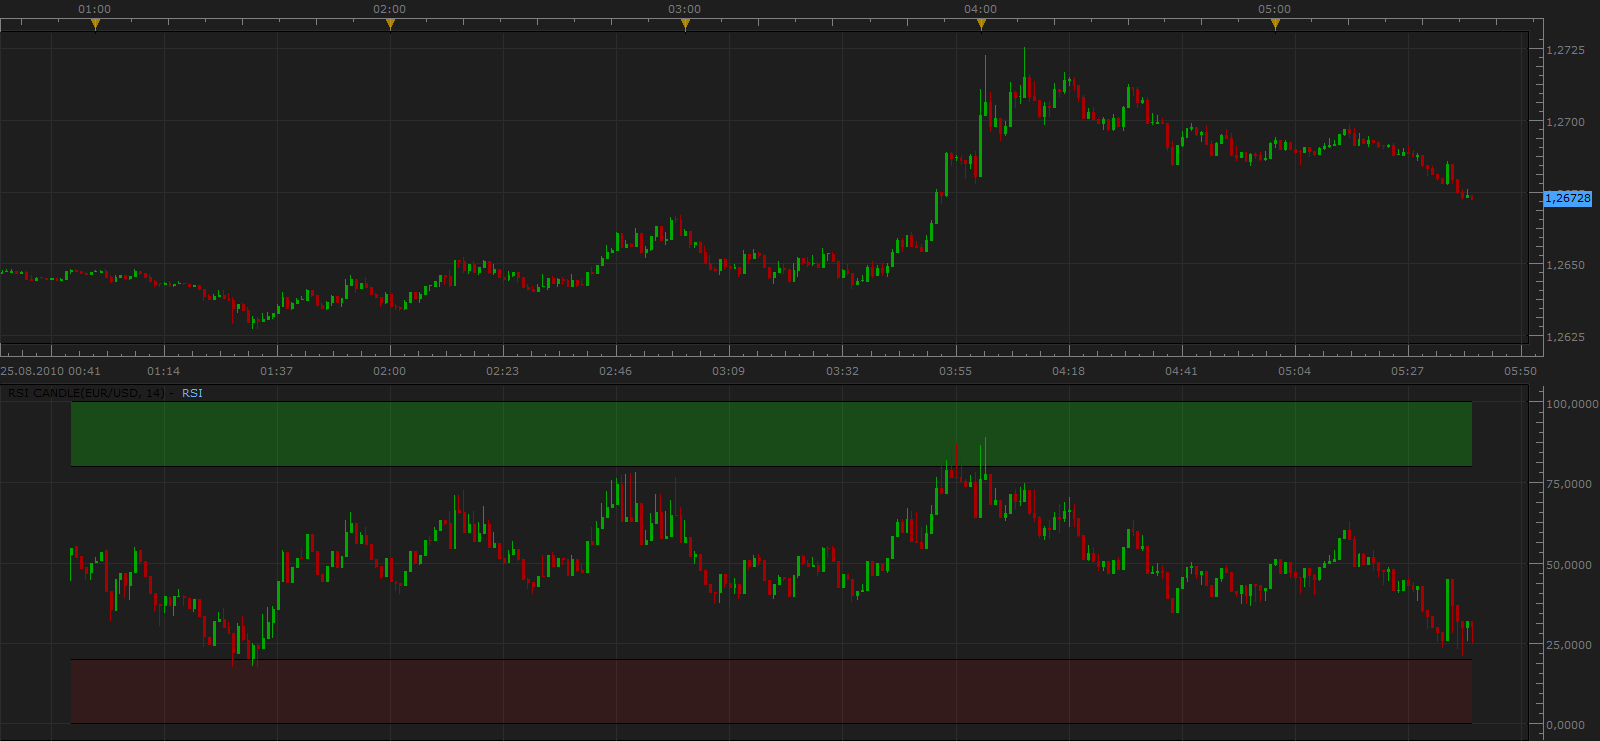
In comparison with the classic RSI, gives us insight into the Open, High, Low and Close values of RSI indicator for the period.
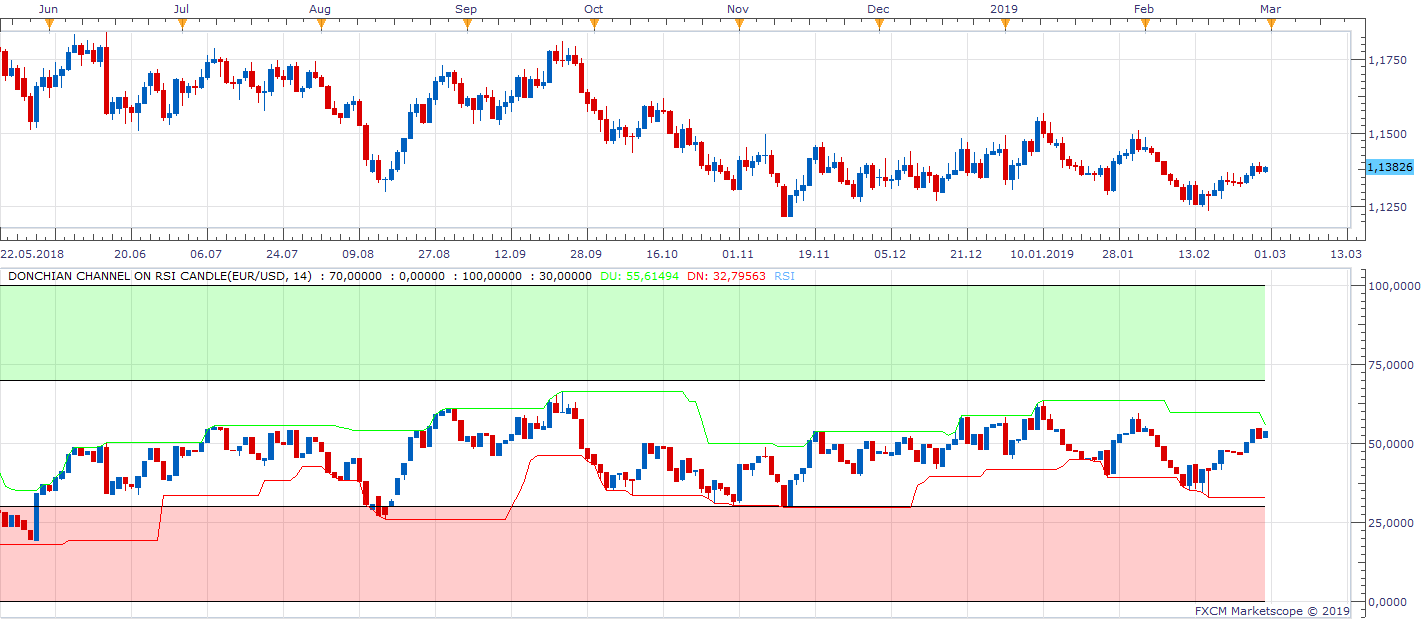
Donchian Channel on RSI Candle.lua
Re: RSI Candle
a135711 · Wed Aug 25, 2010 5:07 am
interesting and definitely on the right track. now we need use the RSI calculation for open and solve for solve for a new open price. and then do the same for new high, new close, new low and then use these new OHLC values to construct a a new price candle. we can then take the RSI out of the indicator box, see it as a candle, and compare the rsi candle to the price candle.
thanks
Re: RSI Candle
Apprentice · Wed Aug 25, 2010 5:24 am
Here we are in trouble, how to translate the RSI value of the Price.
I have already worked several of these indicators. Basically I used the correlation with respect to the initial value, or relative to the High Low range for that period.
If you have an example which you want to have, the formula, would be of great help.
Re: RSI Candle
zekelogan · Wed Aug 25, 2010 10:52 am
An interesting twist on this indicator would be to create dynamic clouds on the upper chart area which would show where the price becomes OB/OS (>80/<20) according to the RSI. A similar way of seeing what this indicator shows, saving screen space for the chart, with more emphasis on price rather than RSI level.
A new indicator called RSI cloud, maybe ??
Re: RSI Candle
Apprentice · Thu Aug 26, 2010 11:50 am
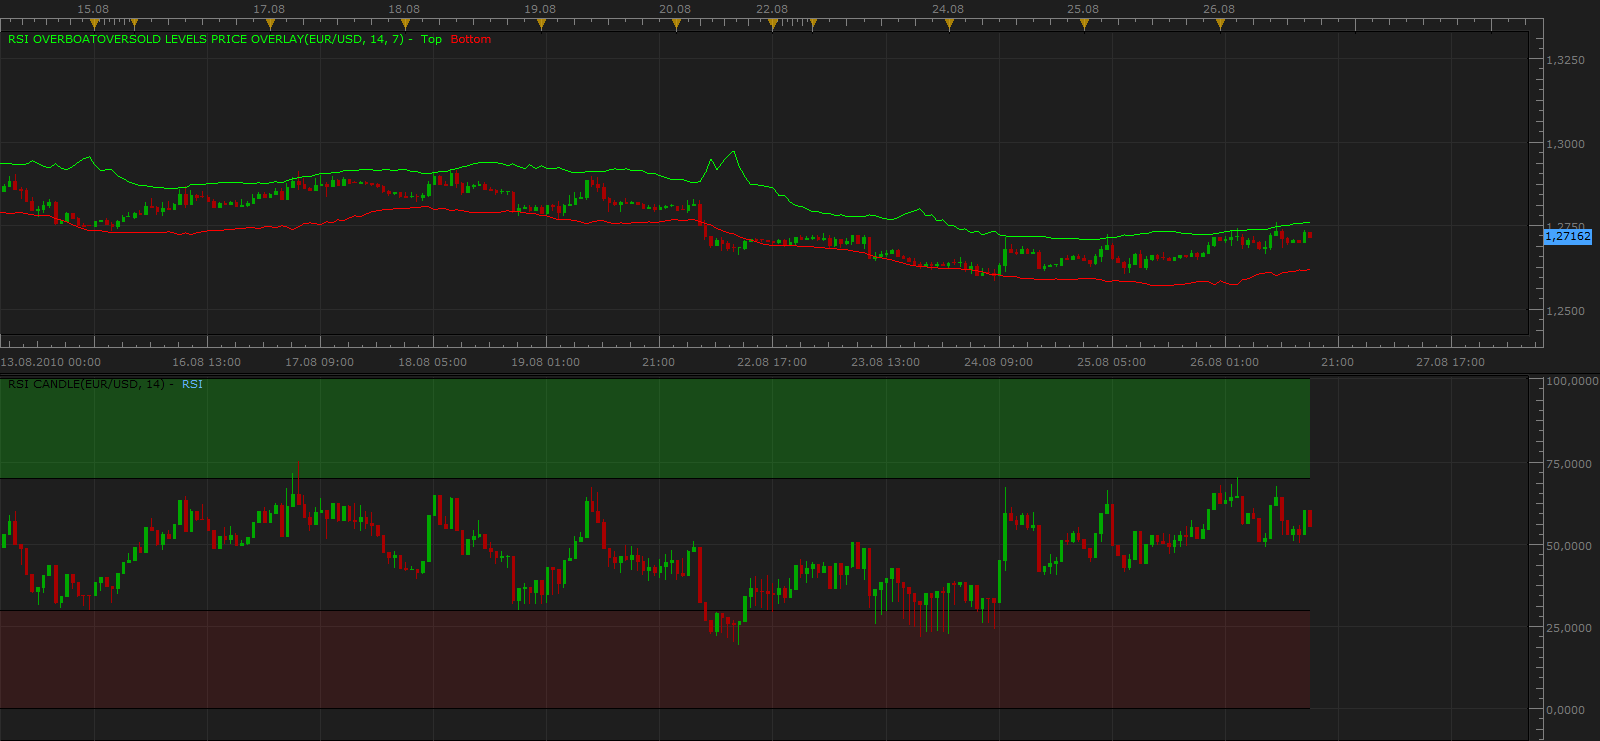
RSI Overboat/Oversold Levels Price Overlay
RSI OverboatOversold Levels Price Overlay.lua
For some reason raw data have excess Volatility, so I applied a smoothing. I have to fix it.
Warning. This is a in development version.
Re: RSI Candle
zekelogan · Thu Aug 26, 2010 1:23 pm
Apprentice….. Very cool
Re: RSI Candle
sedraude · Tue Oct 19, 2010 6:21 am
Hi Apprentice,
Can you make it middle line too (50 value rsi), and also option to display bottom and top rsi.
Thank in advance
Re: RSI Candle
Apprentice · Tue Oct 19, 2010 11:21 am
Done. But I must emphasize that this is still not completed indicator. The algorithm is arbitrary.
If someone can help to finish this job I would be grateful.
Re: RSI Candle
sedraude · Wed Oct 20, 2010 3:55 am
Hi Apprentice,
Thank you for your nice indi
Re: RSI Candle
alepan72 · Thu Apr 07, 2011 7:00 am
Apprentice wrote:
RSI Candle.png
In comparison with the classic RSI, gives us insight into the Open, High, Low and Close values of RSI indicator for the period.
RSI Candle.lua
Updated.
It ‘s a usefull indicator!!! Nice work! Is there the possibilityto ad an option that user can change manual the overbaught - oversold levels? Thanks in advance! Kisses from Greece!
Re: RSI Candle
Nick Marinita · Fri Nov 16, 2012 10:54 am
Helo Apprentice first thank you for all the hard work.I wanted to ask you if it is possible to code this indicator in a way that it does not show any wicks at all and so that the candle operates same as the RSI line witch it already does but without the wicks. Is the only indicator that I use in my trading and it works for me very well is just that those wicks are very annoying. Thank you again.
Re: RSI Candle
Apprentice · Sat Nov 17, 2012 10:02 am
Version that allows you to switch off wicks.
Re: RSI Candle
MathQuant · Wed Jan 30, 2013 6:42 pm
Good work. Thank you
Re: RSI Candle
7510109079 · Tue Jun 24, 2014 11:10 am
excellent thx
Re: RSI Candle
Apprentice · Sun Oct 12, 2014 2:50 am
Update.
Re: RSI Candle
Apprentice · Thu Feb 26, 2015 6:58 am
Bump Up.
Re: RSI Candle
Apprentice · Sun Jul 02, 2017 1:15 pm
The indicator was revised and updated.
Re: RSI Candle
Apprentice · Thu Feb 28, 2019 5:29 am
Donchian Channel on RSI Candle added.
Re: RSI Candle
adloule · Fri Jan 13, 2023 8:37 am
Hello could you please delete the OB/OS zone completely, because even if it’s on off, it’s still visible i would like to delete it completely to give more space for the candles
Re: RSI Candle
Apprentice · Sun Jan 15, 2023 4:45 am
We have added your request to the development list. Development reference 45.
Re: RSI Candle
Apprentice · Tue Jan 17, 2023 7:28 am
Try this version.