fxcodebase-backup
RSI Rainbow Chart
Source: https://fxcodebase.com/code/viewtopic.php?f=17&t=22703
Forum: 17 · Topic 22703 · 4 post(s)
RSI Rainbow Chart
Apprentice · Fri Aug 24, 2012 1:54 am
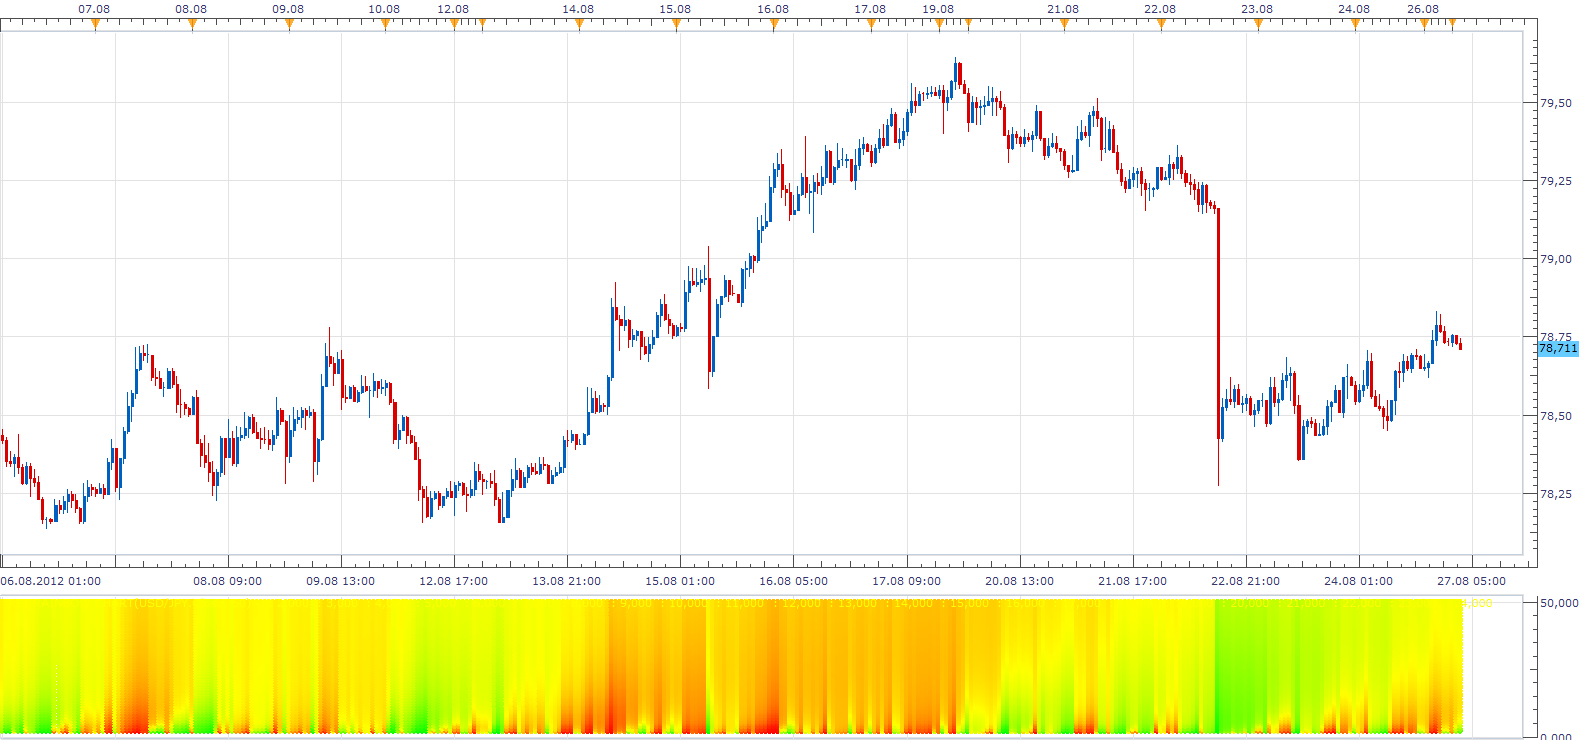
This is a completely new way of data presentation. Shows the value of the indicator for all periods. This is an experimental indicator, further improvements are possible.
This indicator is not about accuracy, rather presentation.
For this purpose it use 3D averaging algorithm. Every data point is an average of 9 points. Current and Lines above and below, Current and periods above and below.
The indicator was revised and updated
Re: RSI Rainbow Chart
Apprentice · Mon Aug 27, 2012 1:48 am
From now onward you have the choice whether you want to use averaging. I have found that 3D averaging blurs glance at current market conditions.
Re: RSI Rainbow Chart
Apprentice · Wed Nov 05, 2014 5:42 am
Performance and presentation update.
Re: RSI Rainbow Chart
Apprentice · Tue Jun 27, 2017 3:43 am
The indicator was revised and updated.