fxcodebase-backup
RSI Value on Chart
Source: https://fxcodebase.com/code/viewtopic.php?f=17&t=65816
Forum: 17 · Topic 65816 · 9 post(s)
RSI Value on Chart
Apprentice · Fri Mar 09, 2018 7:03 am
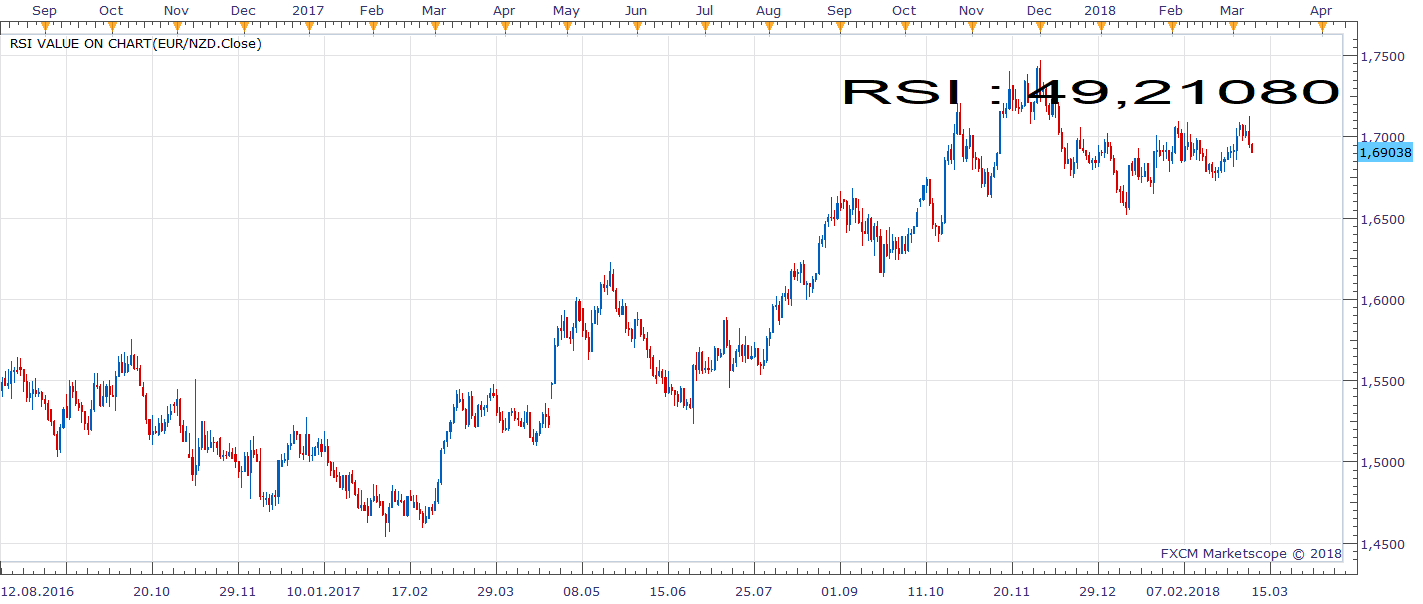
Based on the request. viewtopic.php?f=27&t=65805 Displays the value of the RSI on chart.
Other Timeframe RSI Value on Chart.lua
Re: RSI Value on Chart
jrichardson83 · Fri Mar 09, 2018 9:50 am
Apprentice wrote:
EURNZD D1 (03-09-2018 1102).png
Based on the request. viewtopic.php?f=27&t=65805 Displays the value of the RSI on chart.
RSI Value on Chart.lua
Thanks, its great.
Re: RSI Value on Chart
jrichardson83 · Fri May 25, 2018 7:02 am
Apprentice,
Can you add an Other Timeframe parameter to this indicator. I want to be able to show, for example, the value of the 4-hour RSI on a daily chart. Marketscope only allows selection of higher timeframes above the default period.
Thanks
Re: RSI Value on Chart
Apprentice · Mon May 28, 2018 8:03 am
Other Timeframe RSI Value on Chart.lua added.
Re: RSI Value on Chart
jrichardson83 · Sun Jun 30, 2019 12:58 am
Apprentice,
Can you add an additional three parameters to this indicator for a CCI, MACD, and Stochastic with the ability to turn each one on or off individually.
Re: RSI Value on Chart
Apprentice · Sun Jun 30, 2019 5:43 pm
Your request is added to the development list under Id Number 4753
Re: RSI Value on Chart
Apprentice · Mon Jul 01, 2019 12:48 pm
Try this version.
Re: RSI Value on Chart
jrichardson83 · Sun Jul 14, 2019 3:33 pm
Apprentice wrote:
Value on Chart.lua
Try this version.
Works good except for two issues. The first is that the XY shift function doesn’t seem to operate. I’m inputing values and its not shifting the indicator.
The second is that the MACD shows the MACD and Signal, but no value for the Histogram, which I’m more interested in. In fact, for the MACD can you add the option to show the MACD, Signal, or Histogram only?
Re: RSI Value on Chart
Apprentice · Mon Jul 15, 2019 8:11 am
Try an updated version of Value on Chart.lua