fxcodebase-backup
Smoothed Three Line Break
Source: https://fxcodebase.com/code/viewtopic.php?f=17&t=4340
Forum: 17 · Topic 4340 · 2 post(s)
Smoothed Three Line Break
Apprentice · Wed May 18, 2011 4:50 am
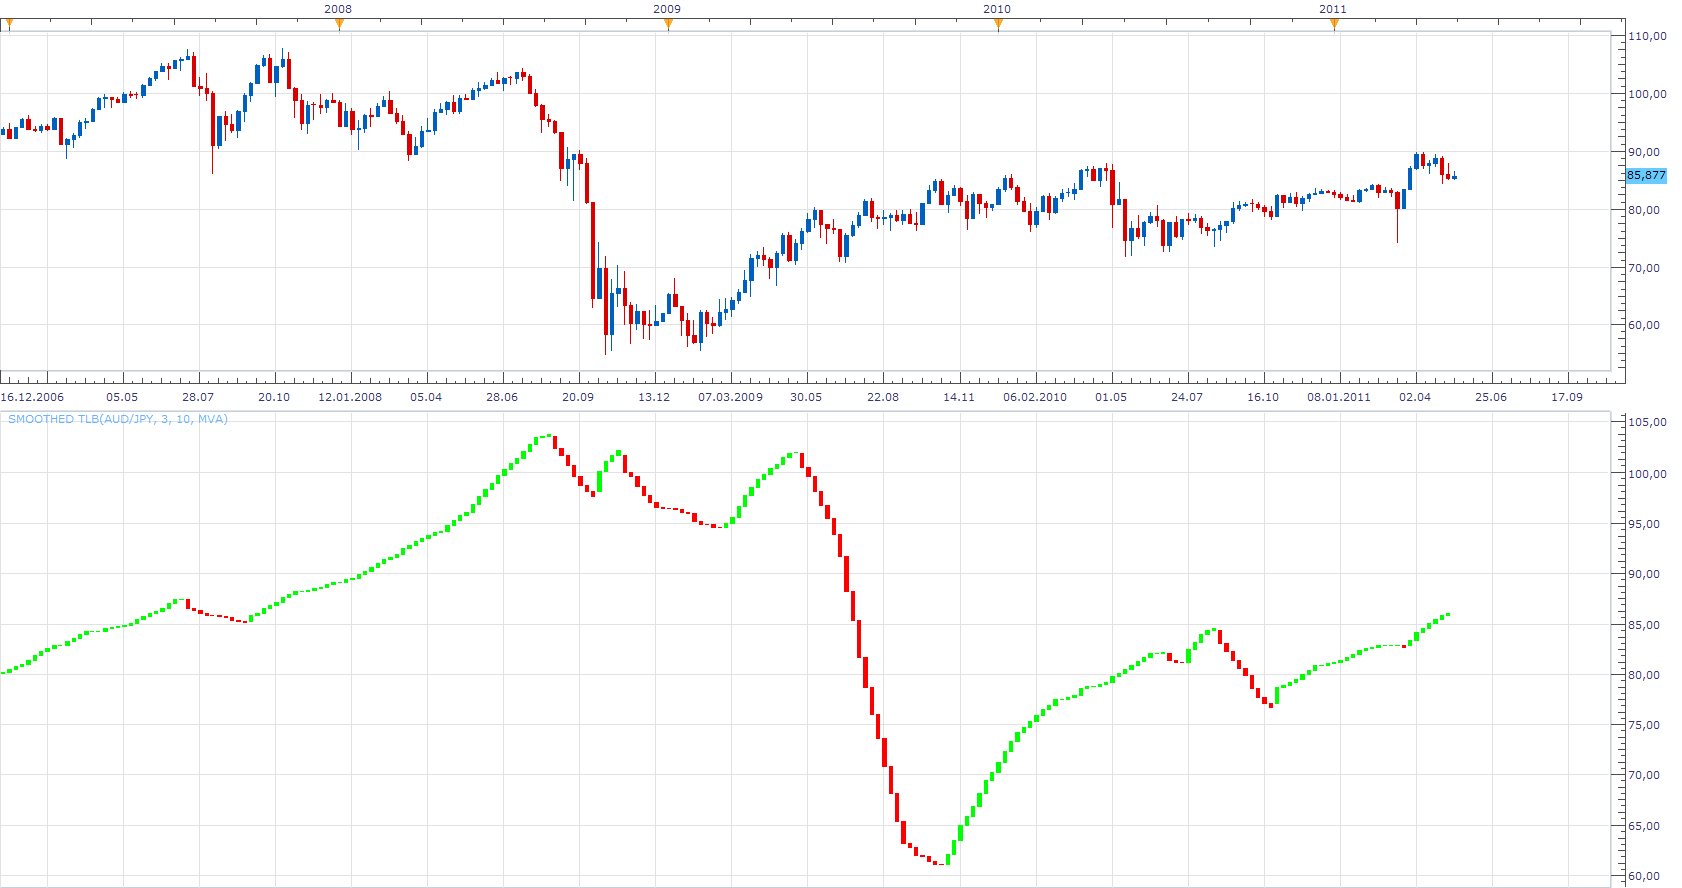
Three Line Break charts display a series of vertical boxes (“lines”) that are based on changes in prices. As with Kagi, Point & Figure, and Renko charts, Three Line Break charts ignore the passage of time, and filters price action.
The term “three line break” comes from the criterion that the price has to break the high or low of the previous three lines in order to reverse and create a line of the opposite color.
The Three Line Break Charts are actually Any Line Break Charts. They are not limited to just a three line reversal. You can create Two Line Break Charts, or even Eighteen Line Break Charts, if you wish.
In This version, prior to the calculation of TLB, the price is Smoothed.
Once again, there is no linear relationship between the TLB and Price time axis.
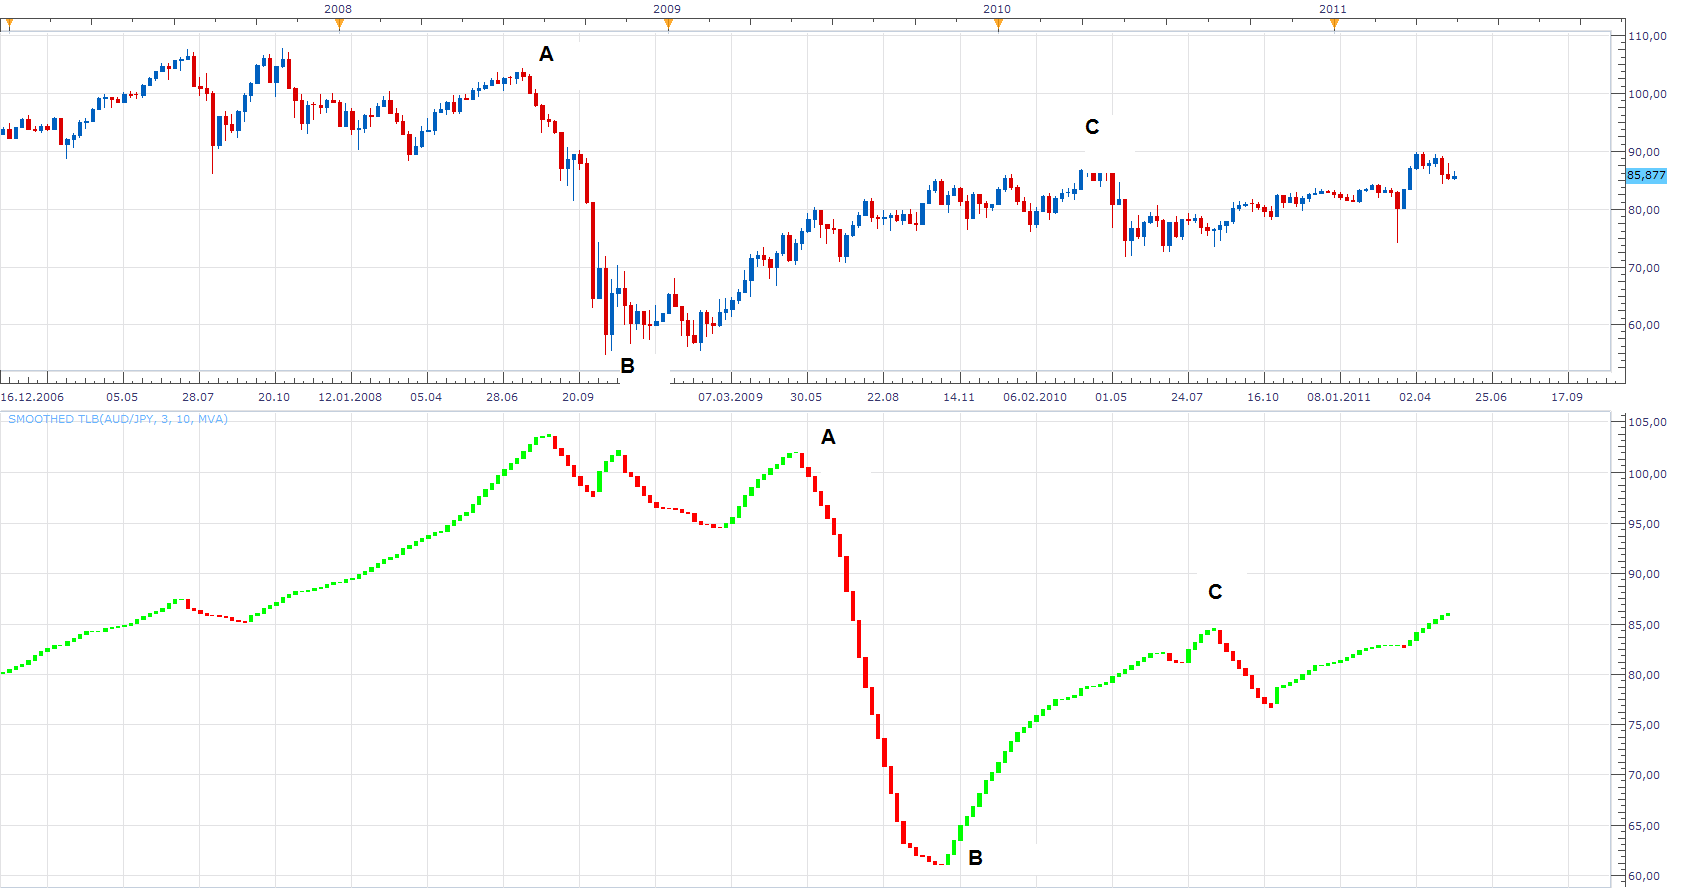
The indicator was revised and updated
Re: Smoothed Three Line Break
Apprentice · Thu Mar 02, 2017 6:04 am
Indicator was revised and updated.