fxcodebase-backup
Tom Demark Moving Average
Source: https://fxcodebase.com/code/viewtopic.php?f=17&t=61278
Forum: 17 · Topic 61278 · 6 post(s)
Tom Demark Moving Average
Apprentice · Sun Sep 28, 2014 6:35 am
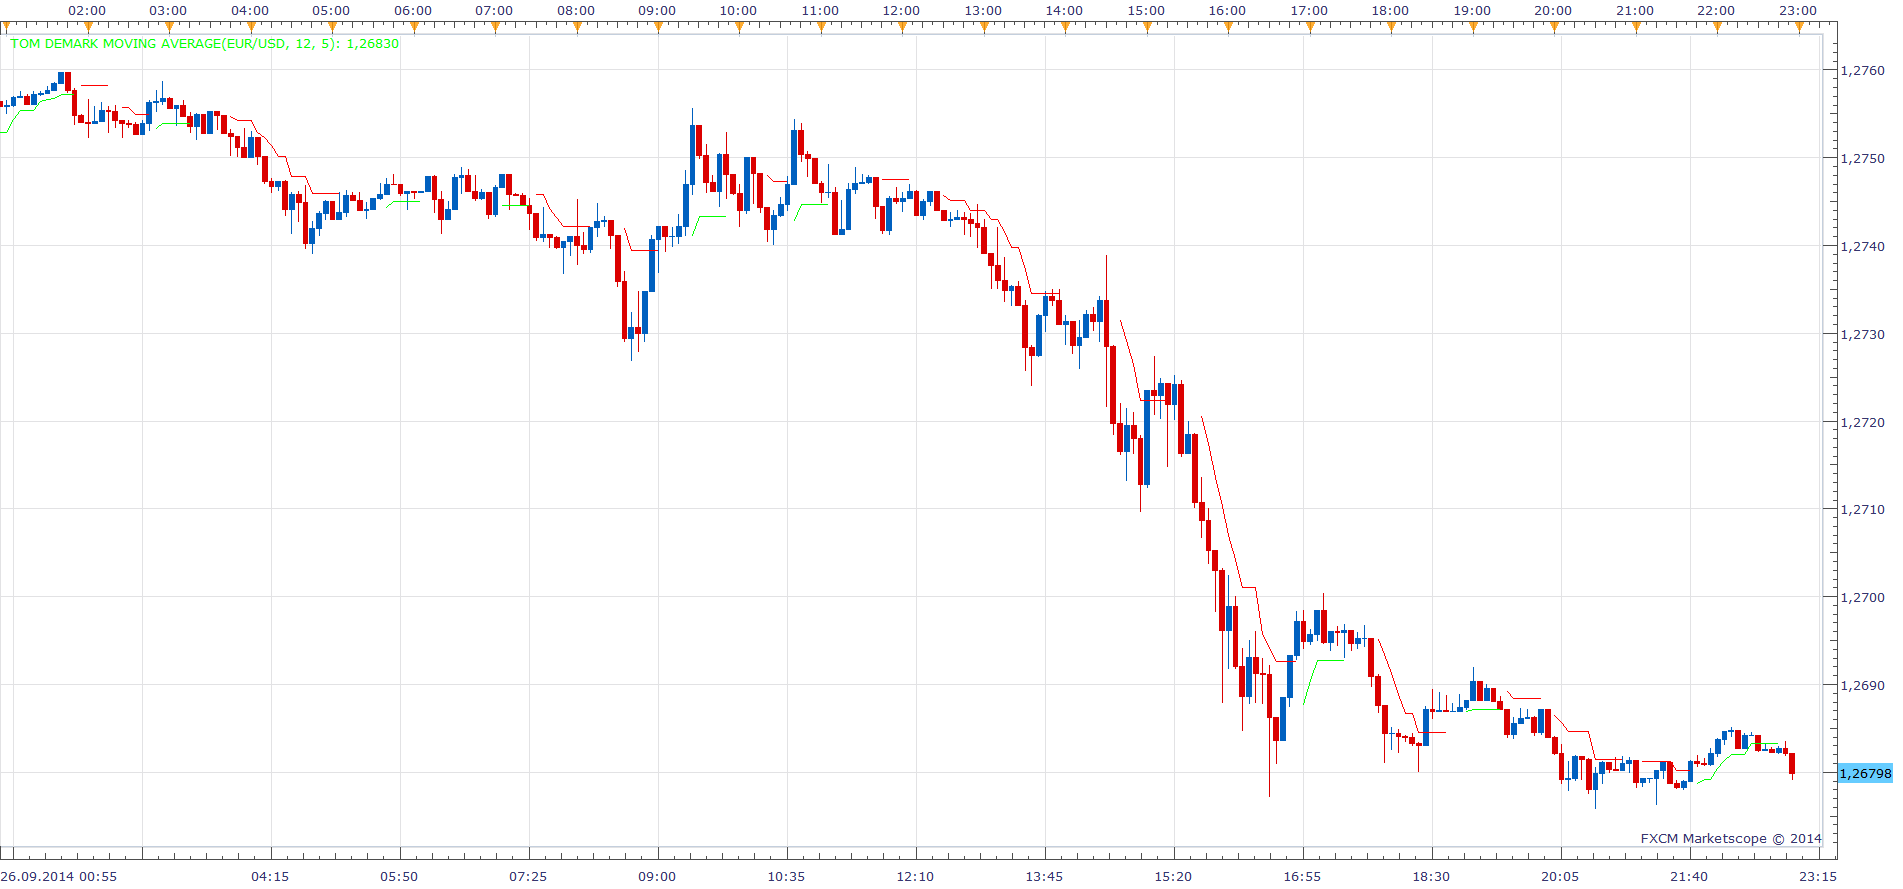
Based on request viewtopic.php?f=27&t=61274
As described in Demark Indicators, page 145 by Jason Perl.
Logic - helps in identifying uptrend / downtrend.
-
Identify a prospective bullish trend first: If price low > 12 prior lows, then selling pressure easing.
-
Plot bullish TD MA once condition (1) is satisfied where
TD MA = 5 bars MA of lows & extends it for another 4 bars (ie. current price bar & 3 more into future).
And if within the next 4 bars & the market does record a low greater than all 12 previous lows, then the 5-bar MA will continue for another 4 bars.
Otherwise, the MA is not plotted.
The indicator was revised and updated
Re: Tom Demark Moving Average
Apprentice · Sun Sep 28, 2014 6:49 am
Algorithm logic Fix. Please Re-Download.
Re: Tom Demark Moving Average
Jeffreyvnlk · Mon Sep 29, 2014 11:57 am
Thanks So the idea is detecting a range market then stay away ? Only go when TDMVA active ? Correct me if I am wrong
Re: Tom Demark Moving Average
Apprentice · Tue Sep 30, 2014 1:30 am
I believe so. As far as I understand the good book on my shelf. The initial purpose was, using it as trailing stop. Subsequently it impose itself for this purpose, to “determine if market is trending”
Re: Tom Demark Moving Average
Alexander.Gettinger · Wed Apr 29, 2015 1:27 pm
MQL4 version of Tom Demark Moving Average: viewtopic.php?f=38&t=62163.
Re: Tom Demark Moving Average
Apprentice · Mon Jul 03, 2017 7:30 am
The indicator was revised and updated.