fxcodebase-backup
Traders Trinity
Source: https://fxcodebase.com/code/viewtopic.php?f=17&t=10882
Forum: 17 · Topic 10882 · 10 post(s)
Traders Trinity
Apprentice · Tue Jan 03, 2012 1:01 pm
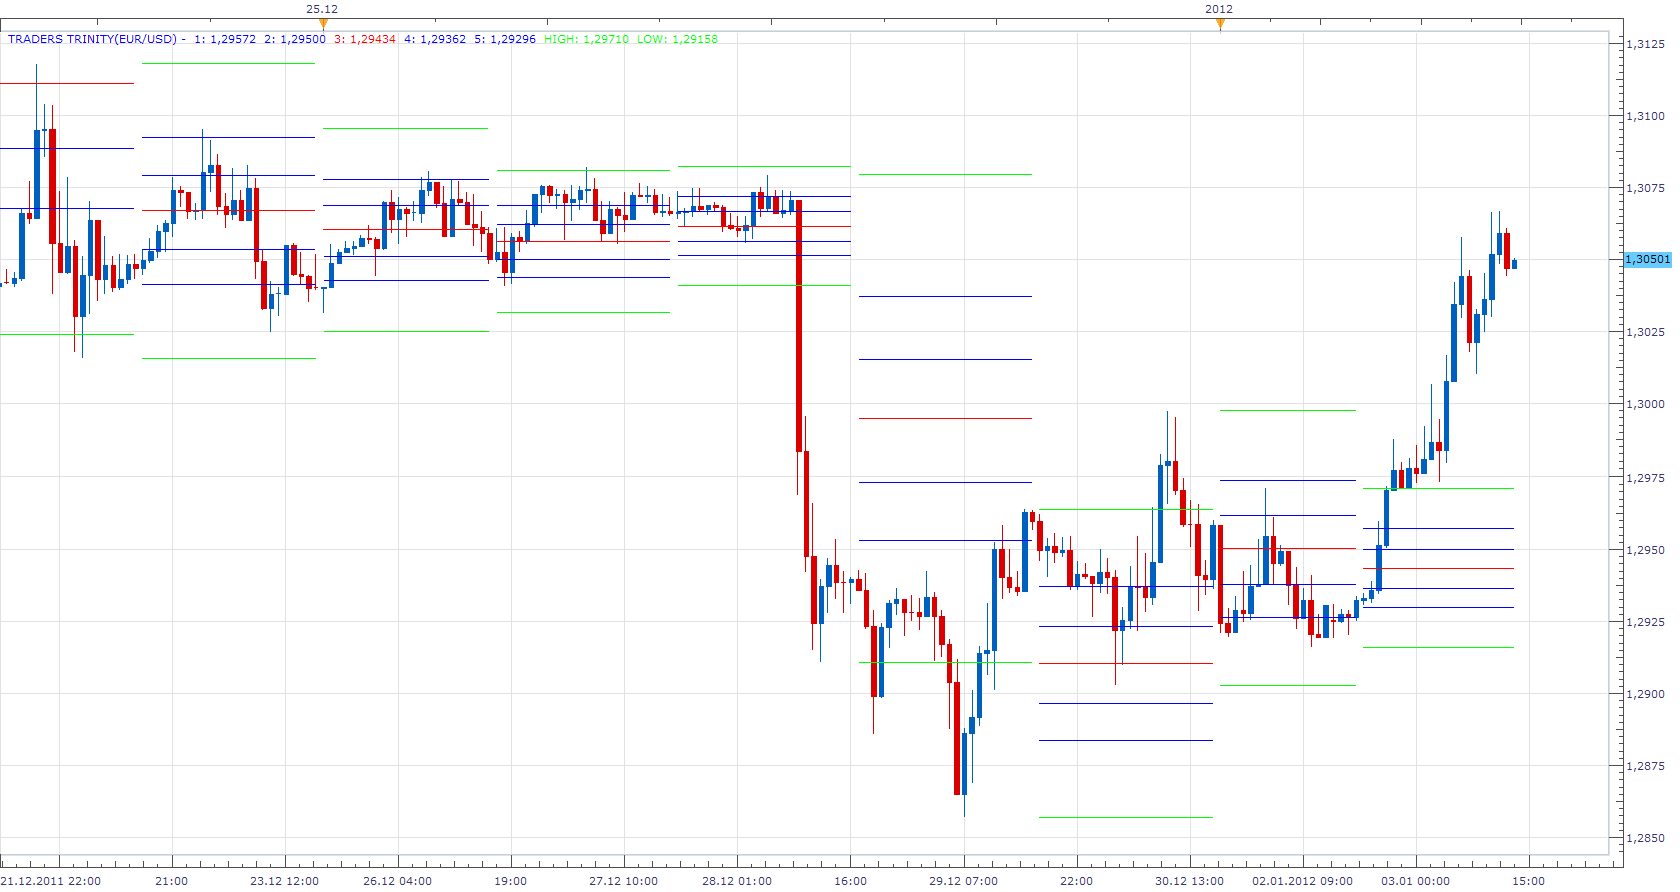
The calculations are always done on the previous period data and the lines are then draw in the next period. Similar to how pivot points are calculated.
Previous period High / Low range, defined levels for the current period. 25%, 37,5%, 50%, 62,5% and 75% Lines are drawn
MT4/MQ4 version. viewtopic.php?f=38&t=64844
Re: Traders Trinity
tastefullvenom · Wed Jan 04, 2012 9:47 am
Hi Apprentice
First of all thanks for working on this.
There is a slight problem with this indicator. When it is set on a daily chart (or higher) with a weekly on montly bigger timeframe parameter setting, it is displayed at the bottom of the chart instead of overlayed. This indicator is meant to work overlayed only. Could you please fix that?
Thanks
Alex
Re: Traders Trinity
tastefullvenom · Fri Jan 06, 2012 8:17 pm
I’m sorry, just realized that I had the wrong setting. Indicator works perfect. Thanks and great job.
Re: Traders Trinity
Blackcat2 · Sun Jan 08, 2012 5:55 pm
When I changed the line style to dots, the lines disappear
Re: Traders Trinity
Apprentice · Sun Jan 08, 2012 6:34 pm
Affirmative, Looks like TS bug.
Re: Traders Trinity
cyanidez · Sun May 20, 2012 8:26 am
SO fantastic, thank you very much for this one!!!
Re: Traders Trinity
Apprentice · Thu May 24, 2012 6:01 am
This forum is not the right place for such advice. On the Internet you can find many resources. Send me private email. I will send you a few recommendations.
Re: Traders Trinity
lazydogs · Wed Jun 20, 2012 11:27 am
I’m not sure if I have the settings incorrect, but the TT only shows the current period, but does not show previous periods. How do I set it to show previous periods? Thanks
Re: Traders Trinity
Apprentice · Fri Jun 22, 2012 2:14 am
You probably are using minute time frames. That is the difference from Trinity and Traders Chart Time frame is too great. Try to use a big chart time frame or smaller for Trinity.
Re: Traders Trinity
Apprentice · Wed Feb 21, 2018 10:38 am
The Indicator was revised and updated.