fxcodebase-backup
Trading day average indicator
Source: https://fxcodebase.com/code/viewtopic.php?f=17&t=12840
Forum: 17 · Topic 12840 · 6 post(s)
Trading day average indicator
Alexander.Gettinger · Sat Feb 04, 2012 9:21 pm
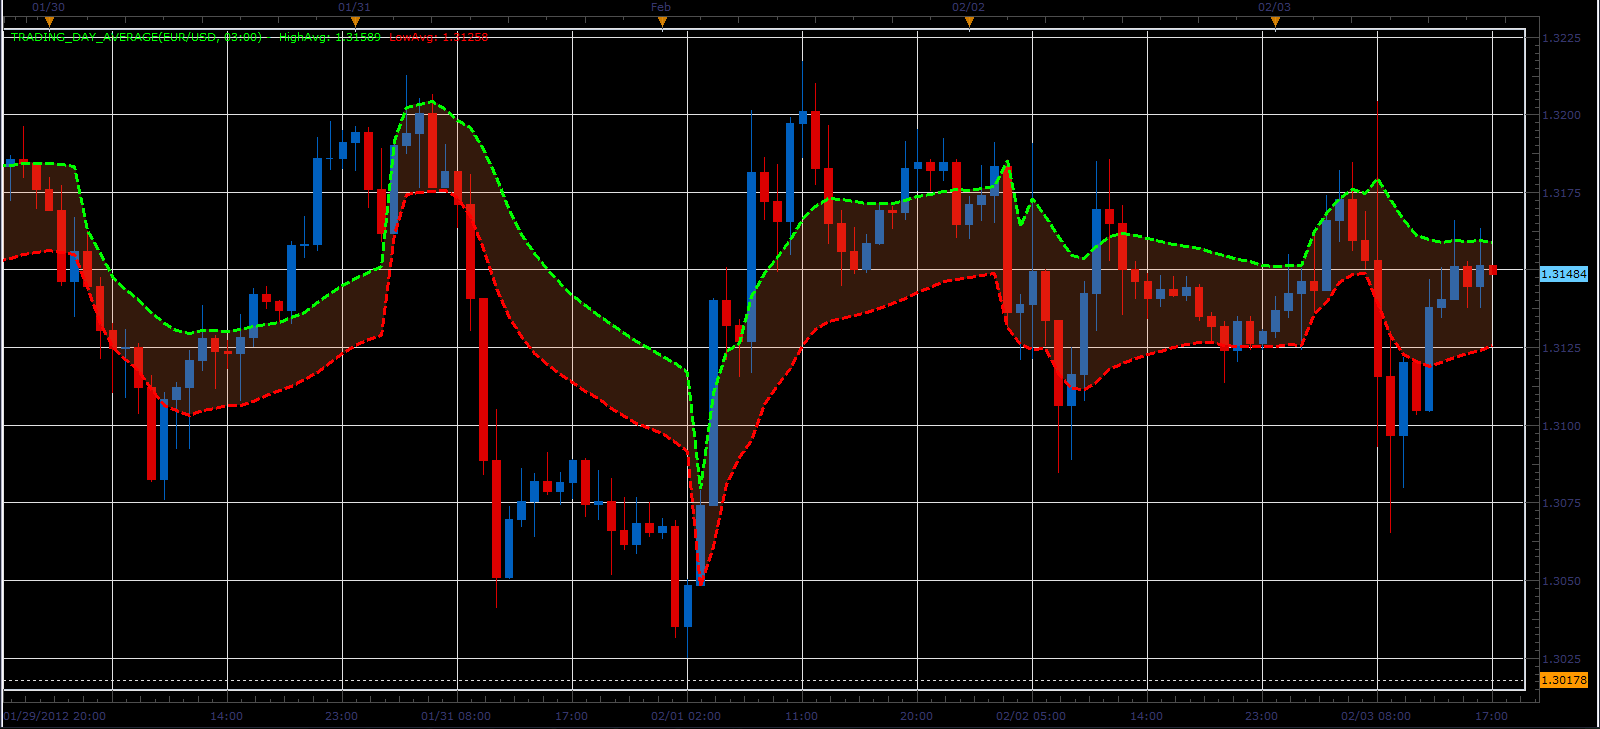
The indicator calculates the values of the average High and Low prices during the trading day. The beginning of the trading day is defined as a parameter.
For example: Timeframe: H1, BeginTime: 02:00 For “02:00” candle: HighAvg(“02:00”)=High(“02:00”), LowAvg(“02:00”)=Low(“02:00”), for “03:00” candle: HighAvg(“03:00”)=(High(“03:00”)+High(“02:00”))/2, LowAvg(“03:00”)=(Low(“03:00”)+Low(“02:00”))/2, etc.
Download:
The indicator was revised and updated
Re: Trading day average indicator
LordTwig · Fri Feb 17, 2012 11:14 pm
Great Job. Thank you for this indicator.
Can you also make a strategy as well? Buy if price goes above High Average Sell if price goes below Low Average
With all the usual strategy options….Stops…Limits …ect including these options: 1) Option to close all opened trades at end of trading day. 2) Option to choose how many trades to open per day.
Btw…. Is it at all possible to restart(break) the (highAve/LowAve) line at start of new day/time? Rather than continual line joining days together.? For better clarity…..
Cheers Lordtwig
Re: Trading day average indicator
Apprentice · Sat Feb 18, 2012 4:17 am
Your request is added to the development list.
Re: Trading day average indicator
Alexander.Gettinger · Thu Feb 23, 2012 10:31 am
Strategy you may find here: http://www.fxcodebase.com/code/viewtopi … 31&t=13893
Re: Trading day average indicator
Alexander.Gettinger · Tue May 08, 2012 5:23 pm
MQL4 version of indicator: viewtopic.php?f=38&t=17983
Re: Trading day average indicator
Apprentice · Tue Apr 04, 2017 5:37 am
Indicator was revised and updated.