fxcodebase-backup
Vertical Lines
Source: https://fxcodebase.com/code/viewtopic.php?f=17&t=70321
Forum: 17 · Topic 70321 · 12 post(s)
Vertical Lines
Apprentice · Mon Aug 24, 2020 5:06 am
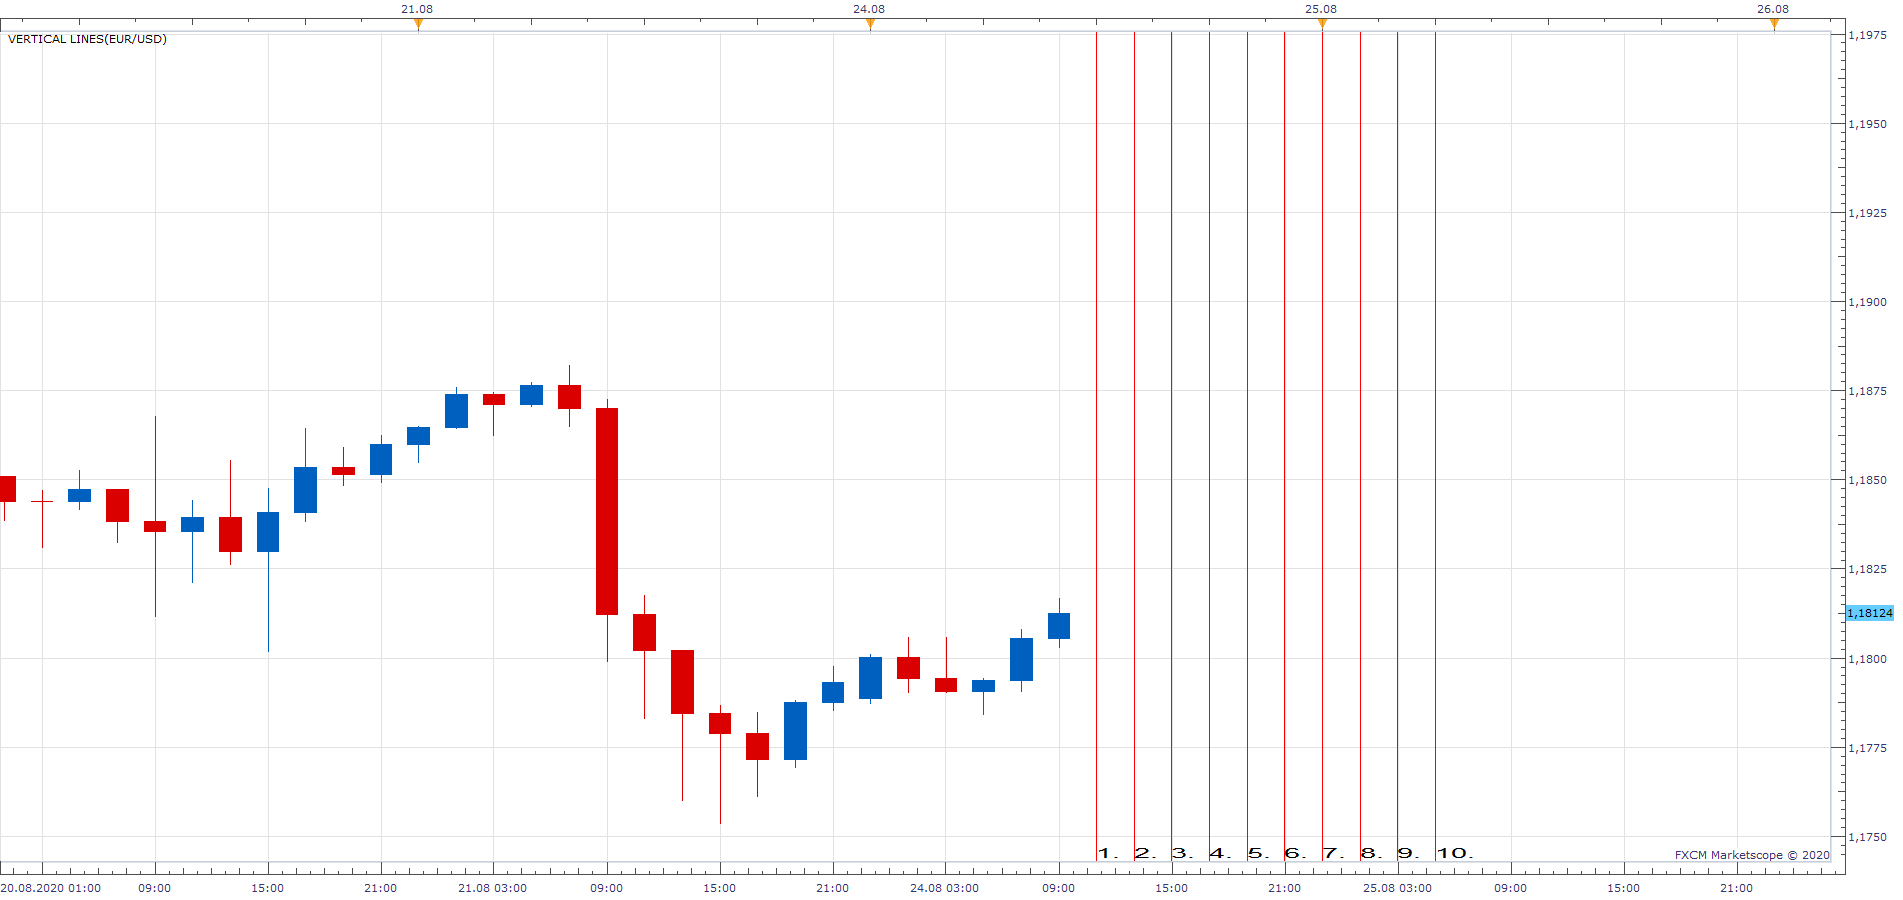
Based on request. viewtopic.php?f=27&t=70318
Re: Vertical Lines
Cuchulain · Mon Aug 24, 2020 2:09 pm
Hello Apprentice,
thank very much, it is what i need )
Just a remark, i think the “use this line “Y/N” dont works. Very best regards Cuchu
Re: Vertical Lines
Apprentice · Tue Aug 25, 2020 5:31 am
Fixed.
Re: Vertical Lines
Mountaintrader · Tue Dec 01, 2020 2:42 pm
Hi Apprentice,
Could the vertical line be configured to also extend down through all below chart indicators ?
Regards
Mountain Trader
Re: Vertical Lines
Apprentice · Wed Dec 02, 2020 3:19 am
Your request is added to the development list. Development reference 2386.
Re: Vertical Lines
Apprentice · Thu Dec 03, 2020 2:37 pm
FXTS2 doesn’t support this. We can write an oscillator that you can apply to the oscillator. Or you can apply it to the oscillator by changing the indicator location.
Re: Vertical Lines
Mountaintrader · Tue Feb 09, 2021 3:33 pm
Thank you for your reply Apprentice,
I was trying to apply the vertical lines to the below chart indicator ‘MTF DMI Heat Map with Alert’ but it appears changing the location prompts the following message
“Its is possible that the selected data source and the current location area don’t match”
Thank you
Regards
Mountain Trader
Re: Vertical Lines
Apprentice · Thu Feb 11, 2021 4:33 am
Try this version.
Please ignore this alert. “Its is possible that the selected data source and the current location area don’t match”
Re: Vertical Lines
Mountaintrader · Thu Feb 11, 2021 5:44 am
Thank you for your reply Apprentice.
The version you recommended places a line in a new area below the DMI Heat Map indicator, I was hopping for a line that passed through the DMI Heat map.
Regards
Mountain Trader
Re: Vertical Lines
Paul W · Wed Nov 29, 2023 10:42 am
is it possible to configure a daily recurring vertical line that is hr/second configurable to a tick chart ?
eg: New York Open
Thx
Re: Vertical Lines
Apprentice · Tue Dec 05, 2023 7:27 am
We have added your request to the development list. Development reference 1081
Re: Vertical Lines
Apprentice · Sat Oct 25, 2025 11:03 am