fxcodebase-backup
Volatility_Reymondpolanco
Source: https://fxcodebase.com/code/viewtopic.php?f=17&t=67421
Forum: 17 · Topic 67421 · 7 post(s)
Volatility_Reymondpolanco
Apprentice · Fri Mar 08, 2019 6:35 am
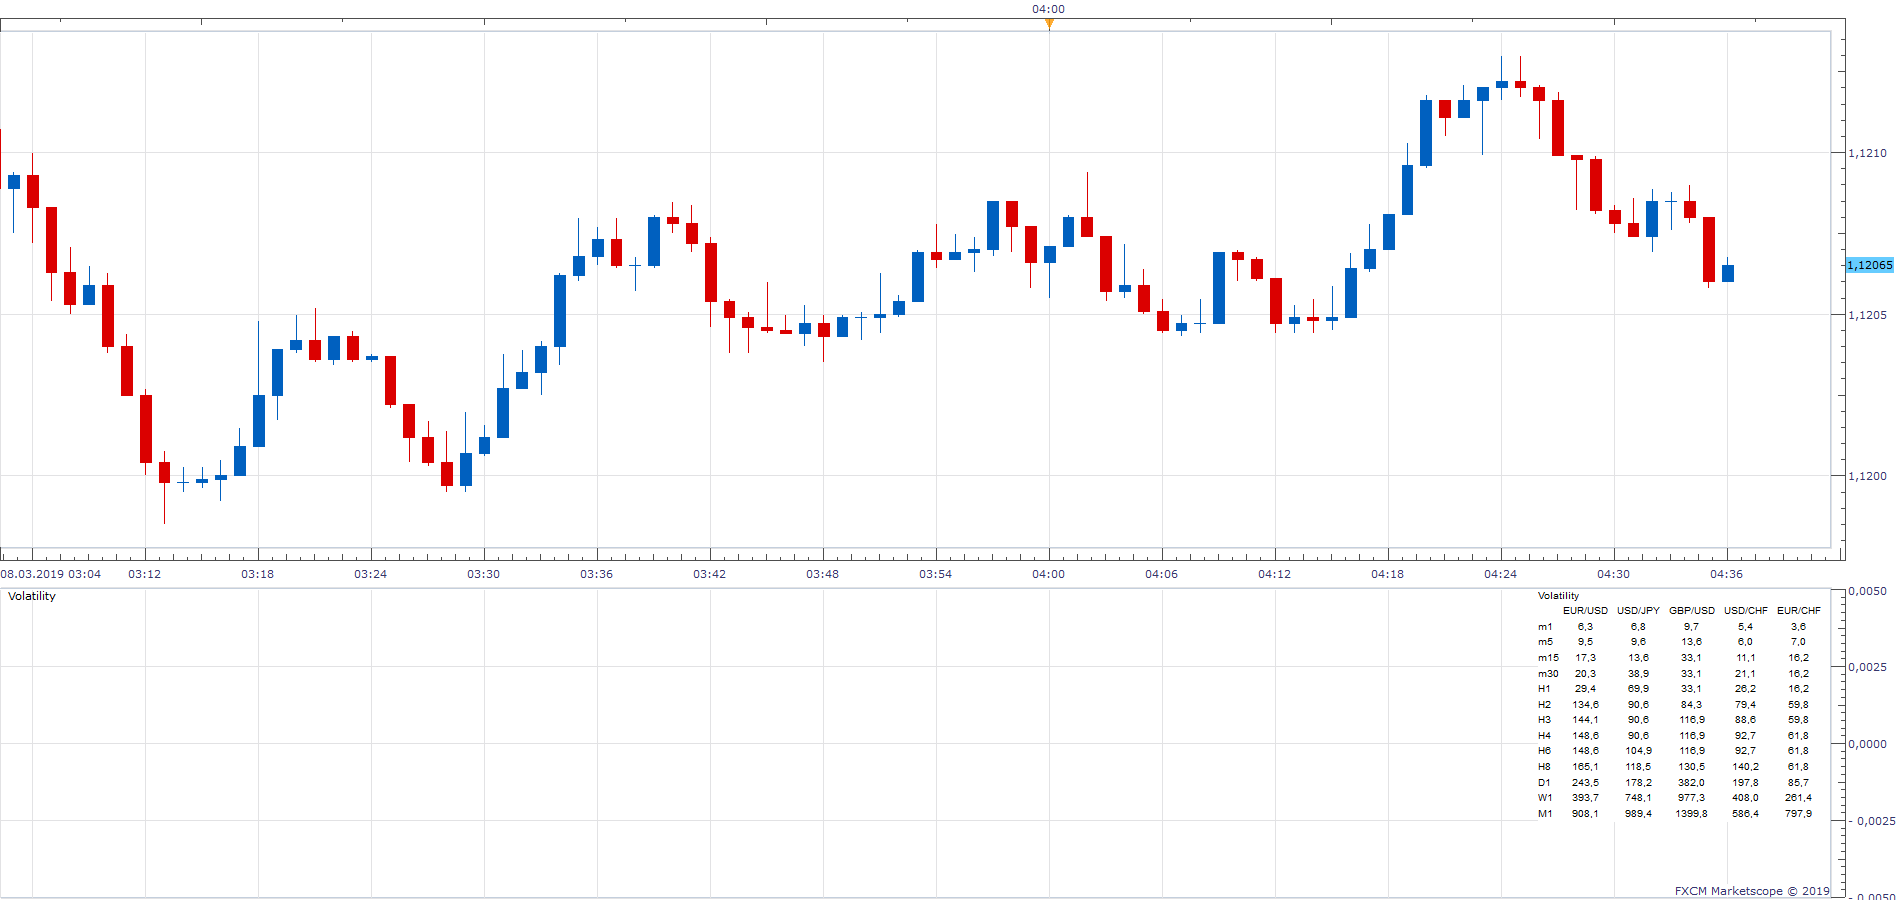
Based on request. viewtopic.php?f=27&t=67391
Re: Volatility_Reymondpolanco
Reymondpolanco · Sat Mar 09, 2019 8:42 pm
Can you add the chart in the left bottom this show the volatility for each day in the month, please add the option to show the number of volatility of this day above the colum. Can you add too the chart in the right that show the volatility of the day in the week with the option to show the number of volatility of this day above the colum, show too the Pips: thats the real volatility we have this data in the indicator you make it but the data show in this part could be the data of the current timefrime of the chart plus add the pips runned that is the pips runned in the current session so with this data i can see how many pips left to the volatility target of the day.
Add this histogram that show the High and Lows with the option to show the selected periods, if i only select the Daily, only show me the high lows daily.
Modify the volatility and add the option to show like you see in the right corner to show only the volatility of the currect pair and show in the right corner.
Check the attached image for reference.
Re: Volatility_Reymondpolanco
Apprentice · Tue Mar 12, 2019 11:46 am
Your request is added to the development list under Id Number 4535
Re: Volatility_Reymondpolanco
Apprentice · Thu Mar 14, 2019 6:49 am
But there are some unknowns: – show the volatility for each day in the month, – show the volatility of the day in the week with the option to show This could be done using separate indicator.
– thats the real volatility. we have this data in the indicator you make it. but the data show – in this part could be the data of the current timefrime plus add the pips runned – that is the pips runned in the current session so with this data i can see how many pips left – to the volatility target of the day.
– Add this histogram that show the High and Lows with the option to show the selected periods, – if i only select the Daily, only show me the high lows daily.
I can’t figure out what it does mean.
Volatility_Reymondpolanco v2.lua
Re: Volatility_Reymondpolanco
Reymondpolanco · Thu Mar 14, 2019 11:20 am
Apprentice wrote: But there are some unknowns: – show the volatility for each day in the month, – show the volatility of the day in the week with the option to show This could be done using separate indicator.
– thats the real volatility. we have this data in the indicator you make it. but the data show – in this part could be the data of the current timefrime plus add the pips runned – that is the pips runned in the current session so with this data i can see how many pips left – to the volatility target of the day.
– Add this histogram that show the High and Lows with the option to show the selected periods, – if i only select the Daily, only show me the high lows daily.
I can’t figure out what it does mean.
The attachment Volatility_Histogram.lua is no longer available
The attachment Volatility_Histogram.lua is no longer available
I try to explain better in the attached image check please
Re: Volatility_Reymondpolanco
Apprentice · Fri Mar 15, 2019 4:59 am
Your request is added to the development list under Id Number 4542
Re: Volatility_Reymondpolanco
Apprentice · Wed Mar 20, 2019 1:51 pm
Volatility_Reymondpolanco v3.lua
But there are still some unknowns. It isn’t obvious what range should be used for high/low values for different timeframes.