fxcodebase-backup
X ticks view
Source: https://fxcodebase.com/code/viewtopic.php?f=17&t=61422
Forum: 17 · Topic 61422 · 2 post(s)
X ticks view
Apprentice · Mon Nov 10, 2014 11:30 am
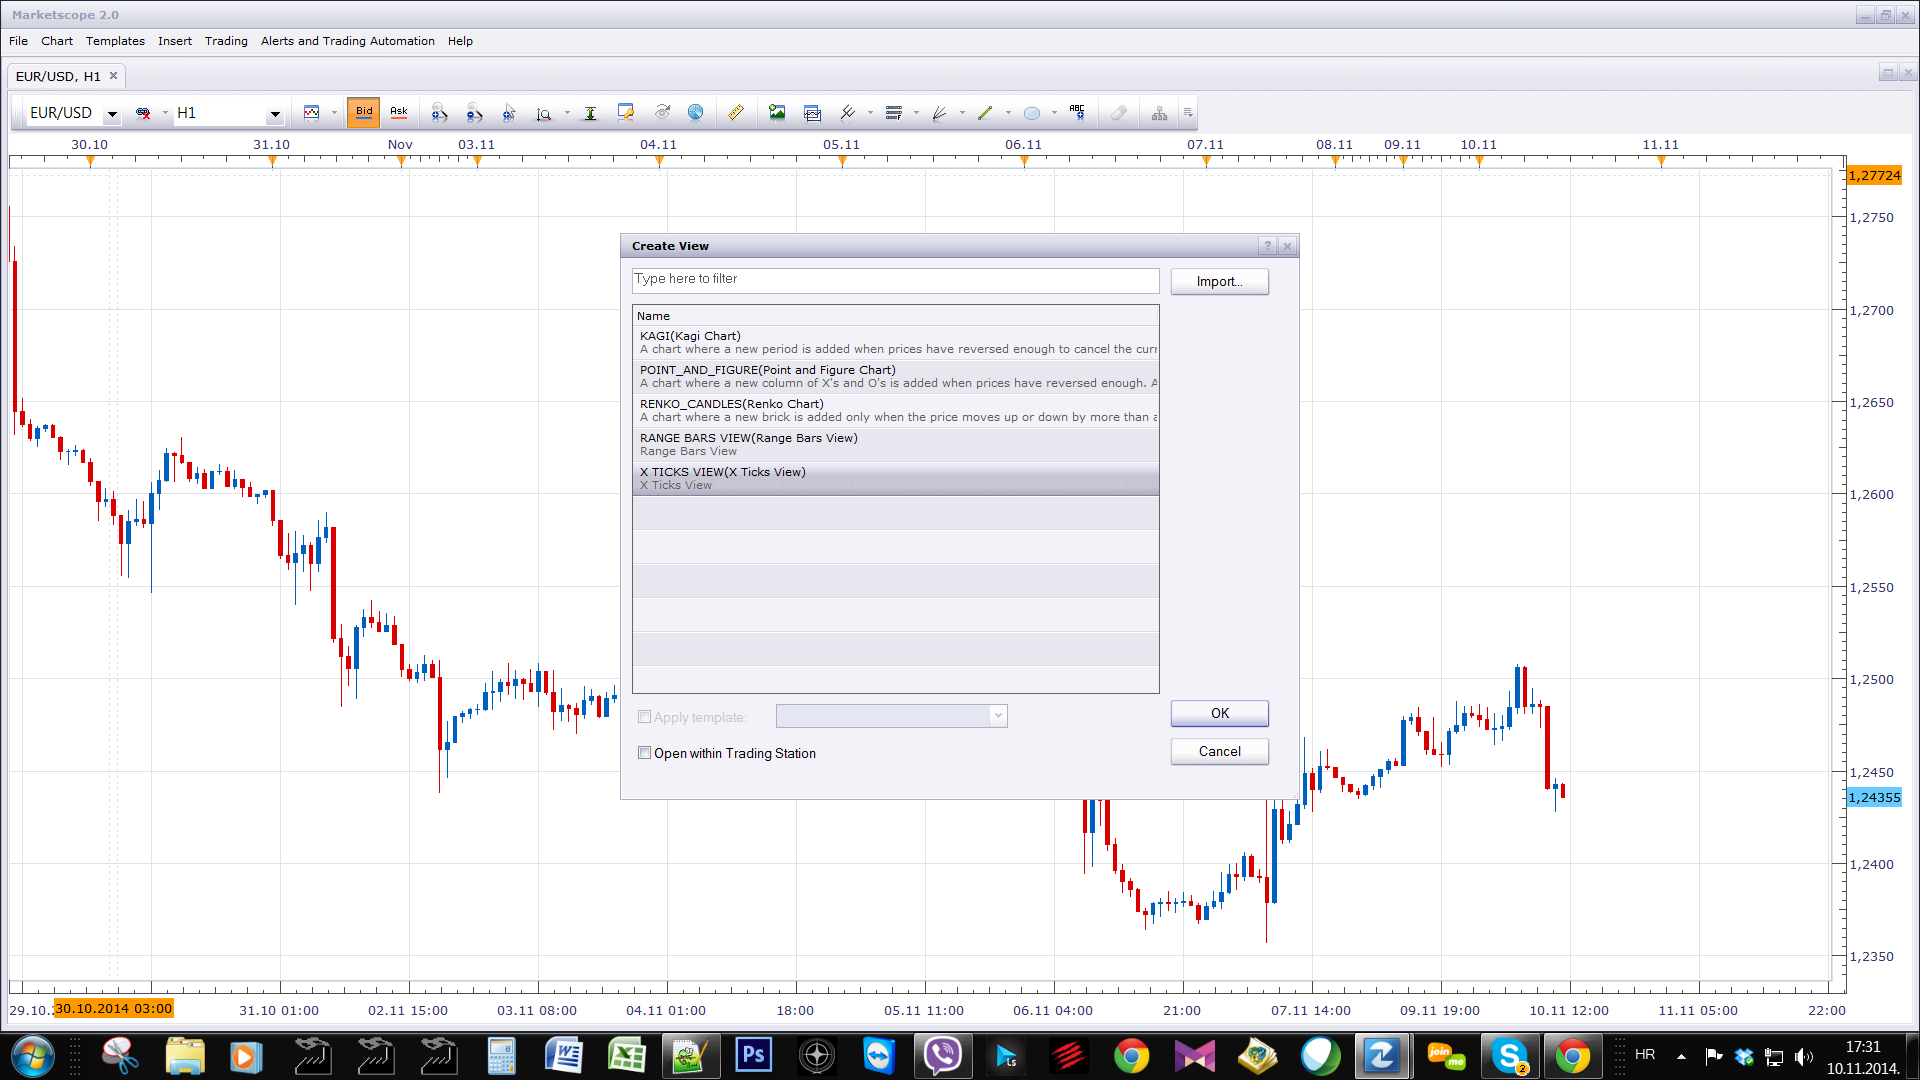
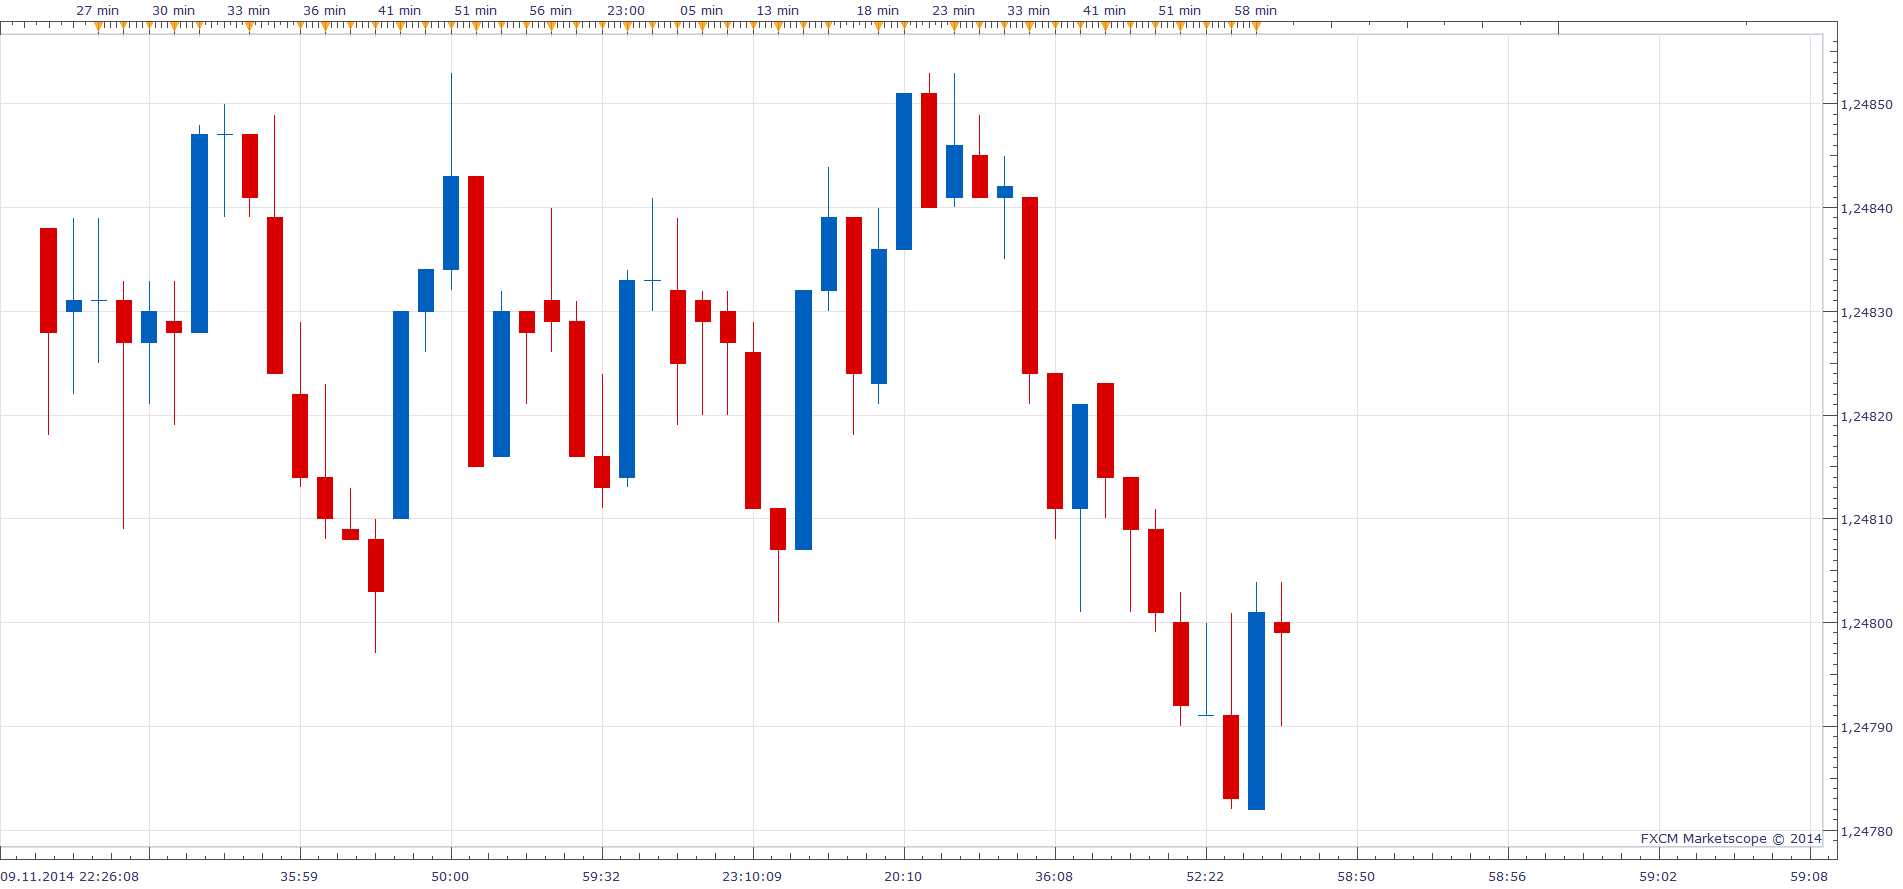
Based on request. viewtopic.php?f=27&t=61362
What is the X ticks (a.k.a. Range Bar) view? A tick represents a transaction between a buyer and a seller at a given price and volume. In the (x) ticks chart each candlestick shows the price variation of x consecutive ticks.
To consider. Native time frame for this Indicator is “t1”. Unfortunately the availability of tick data is a limiting factor.
With a great loss of information, Other time frames can be used. The reason, only closing price is used. Active candle data will not be used.
The indicator was revised and updated
Re: X ticks view
takisd · Sun Nov 20, 2016 2:24 pm
Dear Apprentice,
Is it possible to modify this code to make it work with real volume instead of tick volume on TFs